
Figures & data
Figure 1. Location of the study area
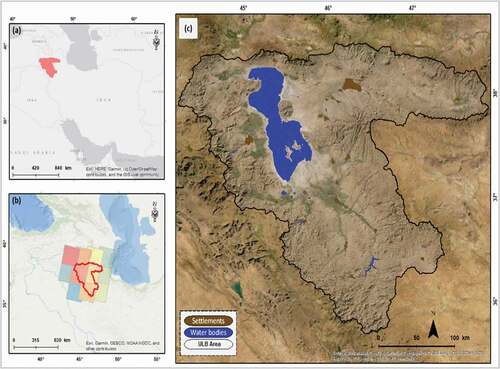
Table 1. List of satellite images and their details
Figure 2. Methodological research scheme
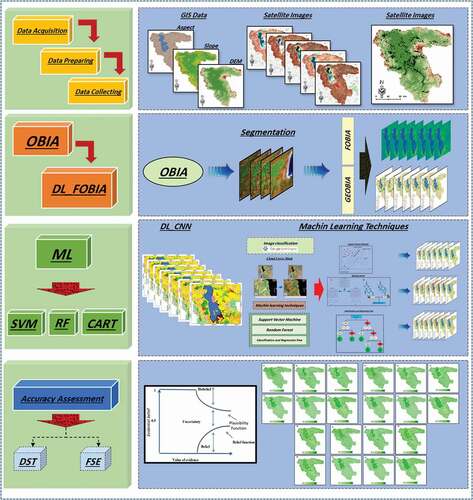
Table 2. LULC classes and their respective thresholds obtained for object features
Table 3. The implemented object features and their correlation between properties and quantifiable attributes
Table 4. Difference function and its respective default values for each category (Feizizadeh Citation2018)
Table 5. Results of the accuracy assessment and ICR values for the FOBIA-DL based classified LULC maps
Figure 3. DST Framework of the spatial uncertainty modeling
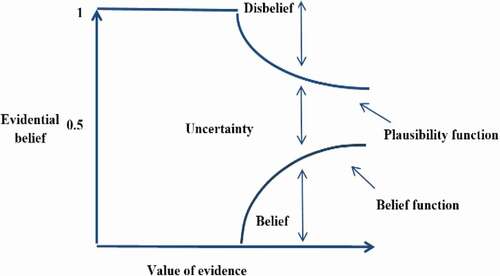
Figure 4. Results of the LULC classification Fuzzy-OBIA-DL, a) 2020, b) 2015, c) 2010, d) 2005, e) 2000, f) 1995 and g) 1990
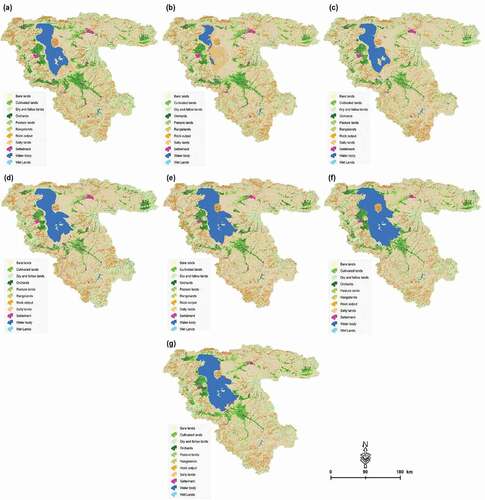
Figure 5. Results of the LULC classification based on the SVM, a) 2020, b) 2015, c) 2010, d) 2005, e) 2000, f) 1995 and g) 1990
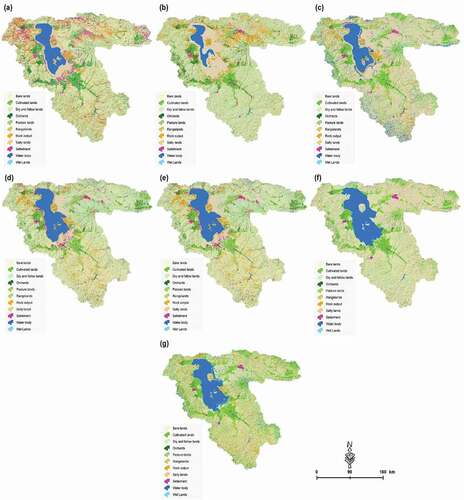
Figure 6. Results of the LULC classification Based on the RF, a) 2020, b) 2015, c) 2010, d) 2005, e) 2000, f) 1995 and g) 1990
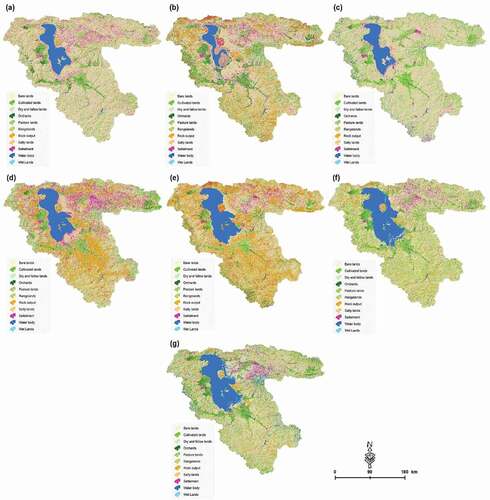
Figure 7. Results of the LULC classification based on the CART, a) 2020, b) 2015, c) 2010, d) 2005, e) 2000, f) 1995 and g) 1990
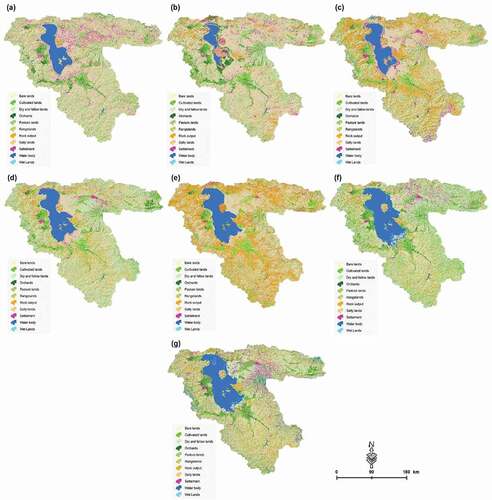
Table 6. Results of the accuracy assessment and ICR values for the FOBIA-DL based classified LULC maps
Figure 8. Fuzzy-OBIA-DL Spatial uncertainty assessment results for LULC maps based on the DST method: a) 2020, b) 2015, c) 2010, d) 2005, e) 2000, f) 1995 and g) 1990
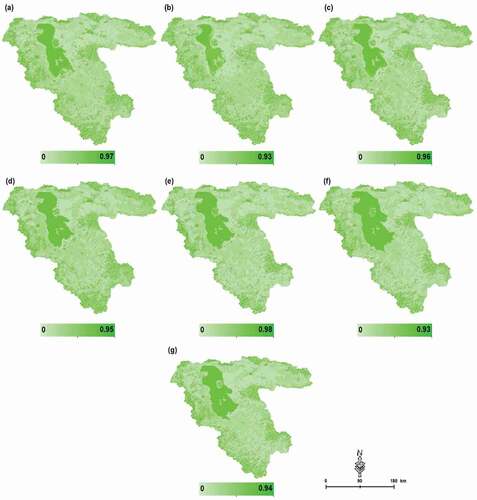
Figure 9. SVM Spatial uncertainty assessment results for LULC maps based on the DST method: a) 2020, b) 2015, c) 2010, d) 2005, e) 2000, f) 1995 and g) 1990
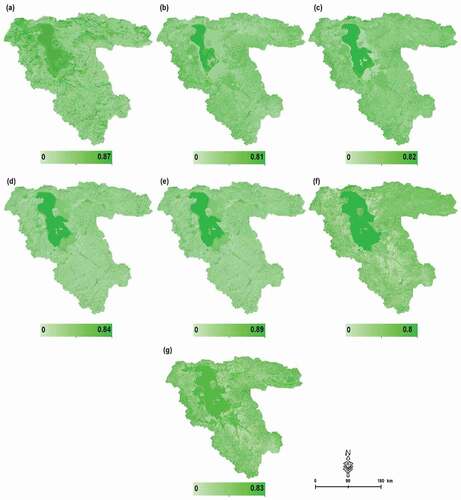
Figure 10. RF Spatial uncertainty assessment results for LULC maps based on the DST method: a) 2020, b) 2015, c) 2010, d) 2005, e) 2000, f) 1995 and g) 1990
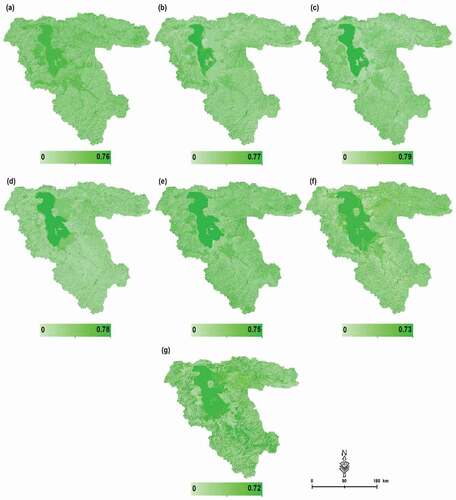
Figure 11. CART Spatial uncertainty assessment results for LULC maps based on the DST method: a) 2020, b) 2015, c) 2010, d) 2005, e) 2000, f) 1995 and g) 1990
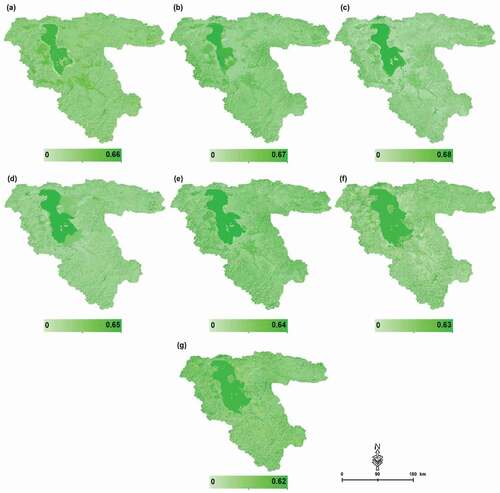
Table 7. Kappa coefficient for each algorithm in each study year
Table 8. LULC area changes (km2)