
Figures & data
Figure 1. Location of the study area and population distribution of the township.
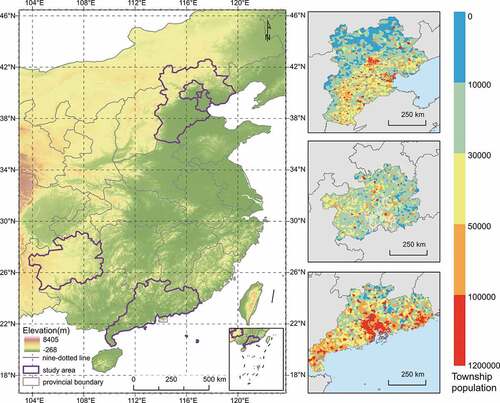
Table 1. Input datasets for multisource map fusion
Figure 2. Distribution maps of the gridded population in the study area: (A) BTRG, (B) Guizhou Province, (C) Guangdong Province; (a) GPW4, (b) LandScan, and (c) WorldPop.
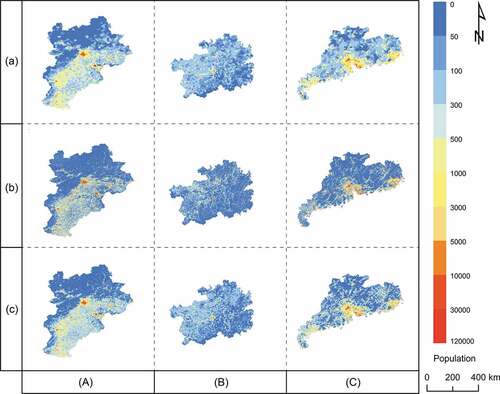
Figure 3. Approaches adopted for producing reference data for an evenly populated area. (a) Impervious surfaces at 30 m resolution, (b) village coordinates, (c) Tyson polygons, (d) Tyson polygons for which the population density information was obtained, (e) impervious surfaces with population density obtained after grid partitioning, and (f) reference data for the area with an even population distribution.
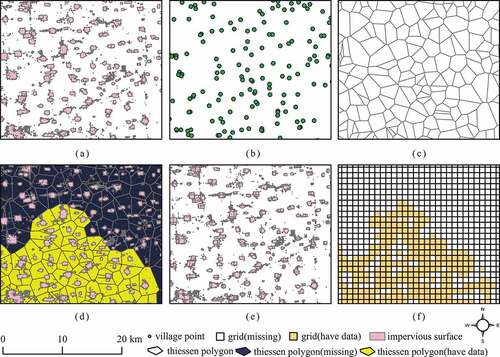
Figure 4. Framework for achieving multisource map fusion.
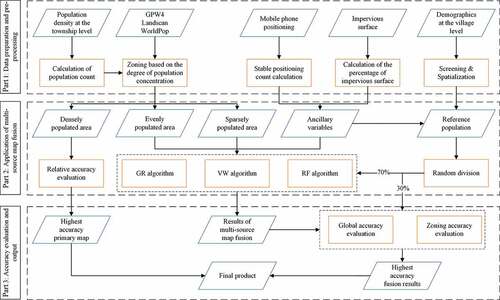
Table 2. Percentage of townships for multiple input maps with different relative error ranges
Figure 5. Heat map representing the root-mean-squared error of different algorithms (a for RF algorithm, b for VW algorithm, c for GR algorithm; A refers to Guizhou Province, B is Guangdong Province, and C is BTHR).
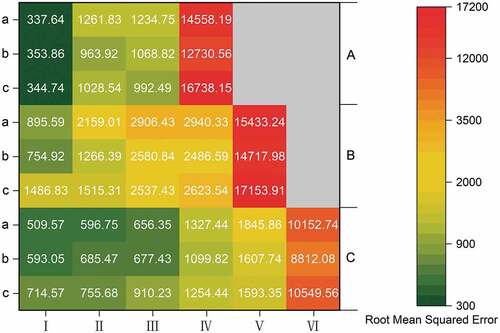
Figure 6. Heat map representing the mean absolute error of different algorithms (a for RF algorithm, b for VW algorithm, c for GR algorithm; A refers to Guizhou Province, B is Guangdong Province, and C is BTHR).
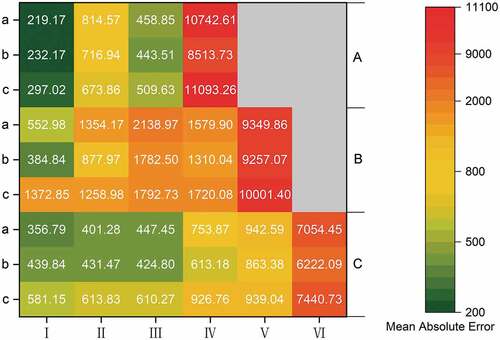
Table 3. Evaluation indicator values reported for different data in a total perspective
Figure 7. Taylor diagram describing the overall accuracy of the different data. Note. A: GPW4, B: LandScan, C: WorldPop, D: Variance weighted algorithm, E: Granger-Ramanathan algorithm with Case 1, F: Random forest algorithm with Case 1, G: Granger-Ramanathan algorithm with Case 2, H: Random forest algorithm with Case 2; a: BTHR, b: Guizhou Province, c: Guangdong Province.
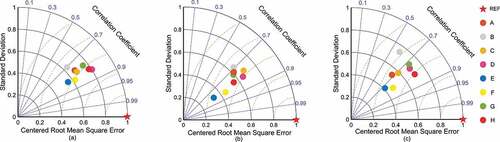
Figure 8. Final output: The most accurate fusion result is spliced with WorldPop in the sparsely populated area (A: BTHR, B: Guizhou Province, C: Guangdong Province).
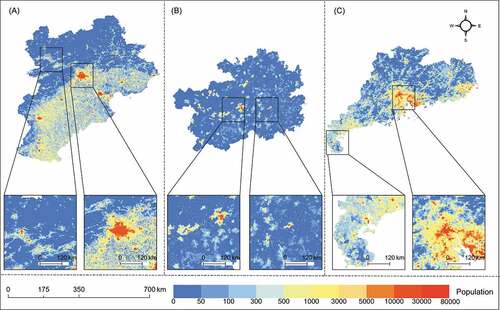
Table 4. Relative importance of different variables for the RF algorithm in BTHR, Guangdong Province, and Guizhou Province
Data availability statement
The data and codes that support the findings of this study are openly available in [figshare] at [https://www.doi.org/10.6084/m9.figshare.14740272].