
Figures & data
Figure 1. The classification of transition rules involved in this paper.
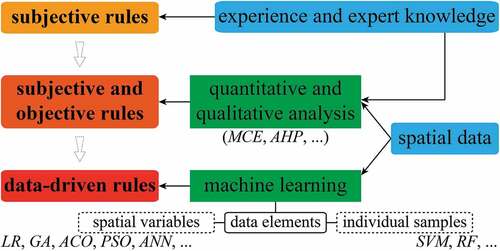
Figure 2. The urban growth of Beijing, Tianjin, and Wuhan during 2000–2020. The central zones of Beijing, Tianjin, and Wuhan have been enlarged to show details.
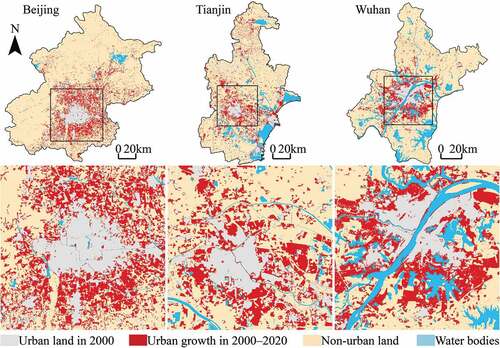
Figure 3. The spatial variables used to model the urban growth of Beijing, including dis2CC, dis2DC, dis2TC, dis2TRW, dis2PRW, dis2SEW, dis2TEW, dis2RST, dis2EEM, dis2WAB, Eleva, and Slope. Labels and units of spatial variables are explained in .
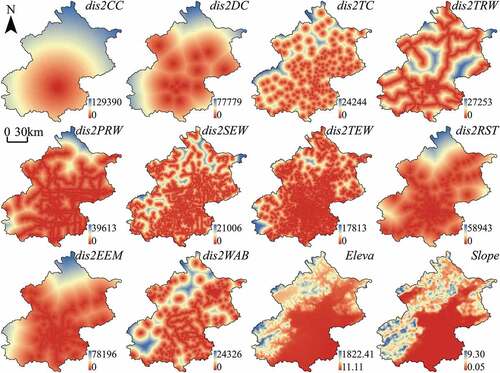
Figure 4. The spatial variables used to model the urban growth of Tianjin, including dis2CC, dis2DC, dis2TC, dis2TRW, dis2PRW, dis2SEW, dis2TEW, dis2RST, dis2EEM, dis2WAB, Eleva, and Slope. Labels and units of spatial variables are explained in .
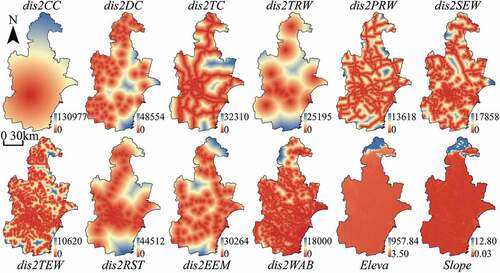
Figure 5. The spatial variables used to model the urban growth of Wuhan, including dis2CC, dis2DC, dis2TC, dis2TRW, dis2PRW, dis2SEW, dis2TEW, dis2RST, dis2EEM, dis2WAB, Eleva, and Slope. Labels and units of spatial variables are explained in .
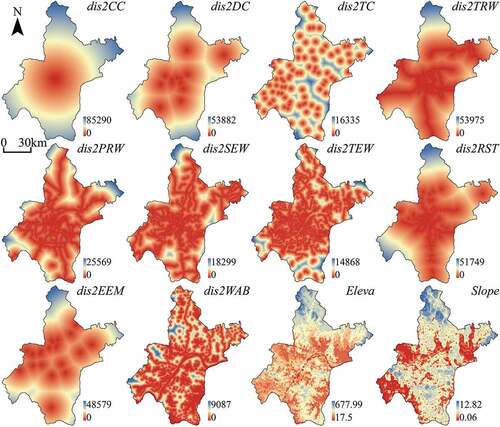
Table 1. The details of spatial factors and corresponding spatial variables
Figure 6. The diagrams of forward hinge feature (left) and reverse hinge feature (right).
Figure 7. The architecture of the ANN model used in this study. Labels of spatial variables are explained in .
Table 2. The training and testing AUC values of the LR, ANN, SVM, and MaxEnt models, and the RMSE values of their projected TPMs
Figure 8. Transition potential maps of Beijing projected by LR, ANN, SVM, and MaxEnt models. The central zone of Beijing has been enlarged to show spatial details.
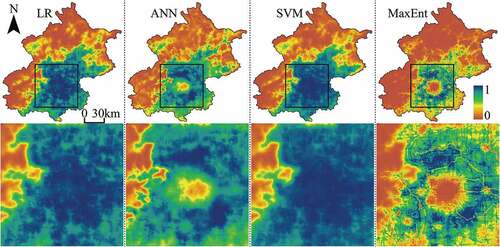
Figure 9. Transition potential maps of Tianjin projected by LR, ANN, SVM, and MaxEnt models. The central zone of Tianjin has been enlarged to show spatial details.
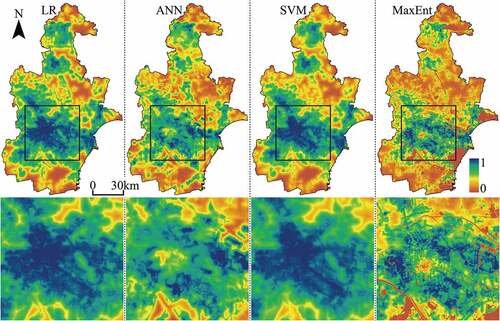
Figure 10. Transition potential maps of Wuhan projected by LR, ANN, SVM, and MaxEnt models. The central zone of Wuhan has been enlarged to show spatial details.
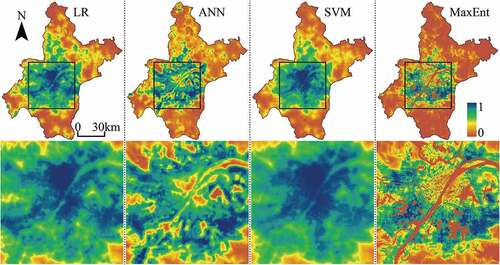
Table 3. The training and projecting time (second) for the LR, ANN, SVM, and MaxEnt models in Beijing, Tianjin, and Wuhan
Figure 11. The observed urban growth in Beijing from 2000 to 2020 and the urban growth simulated by LR-CA, ANN-CA, SVM-CA and MaxEnt-CA models.
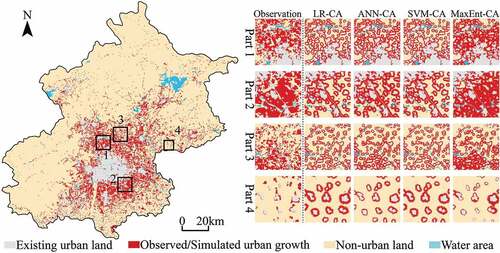
Figure 12. The observed urban growth in Tianjin from 2000 to 2020 and the urban growth simulated by LR-CA, ANN-CA, SVM-CA and MaxEnt-CA models.
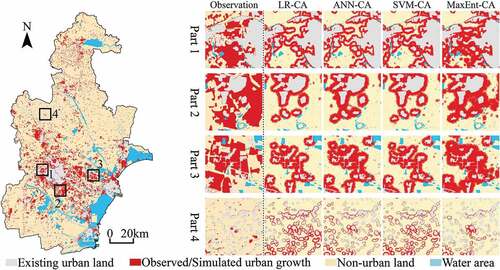
Figure 13. The observed urban growth in Wuhan from 2000 to 2020 and the urban growth simulated by LR-CA, ANN-CA, SVM-CA and MaxEnt-CA models.
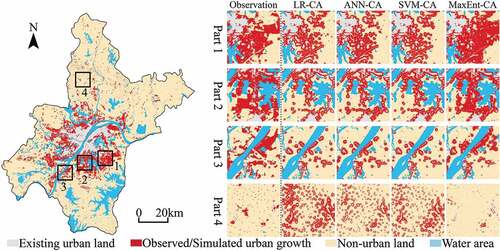
Table 4. The simulation accuracies of LR-CA, ANN-CA, SVM-CA, and MaxEnt-CA models in Beijing, Tianjin, and Wuhan
Table 5. The landscape metrics of the urban landscape simulated by LR-CA, ANN-CA, SVM-CA, and MaxEnt-CA models in Beijing, Tianjin, and Wuhan
Table 6. Partial selected features and corresponding parameters used in the MaxEnt modeling of the urban growth of Beijing. Labels of spatial variables are explained in
Table 7. Product features used in the MaxEnt modeling of the urban growth of Beijing, Tianjin, and Wuhan. Labels of spatial variables are explained in
Figure 14. The response curves showing the relationship between urban growth of Beijing and spatial variables dis2CC, dis2DC, dis2TC, dis2TRW, dis2PRW, dis2SEW, dis2TEW, dis2RST, dis2EEM, dis2WAB, Eleva, and Slope. Labels of spatial variables are explained in .
Figure 15. The response curves showing the relationship between urban growth of Tianjin and spatial variables dis2CC, dis2DC, dis2TC, dis2TRW, dis2PRW, dis2SEW, dis2TEW, dis2RST, dis2EEM, dis2WAB, Eleva, and Slope. Labels of spatial variables are explained in .
Figure 16. The response curves showing the relationship between urban growth of Wuhan and spatial variables dis2CC, dis2DC, dis2TC, dis2TRW, dis2PRW, dis2SEW, dis2TEW, dis2RST, dis2EEM, dis2WAB, Eleva, and Slope. Labels of spatial variables are explained in Table 1.
Table 8. The percent contributions of spatial variables in the MaxEnt modeling of the urban growth of Beijing, Tianjin, and Wuhan. Labels of spatial variables are explained in