
Figures & data
Figure 1. The location of the study area: (a) The location of Harbin in Heilongjiang Province, P.R. China (China Map Examination No. is GS (2019) 1822); (b) The location of Maoershan Experimental Forest Farm in Shangzhi of Harbin; (c) The location of sample plots in Maoershan. The projection coordinate system for (b) and (c) is WGS 1984 UTM Zone 52 N.
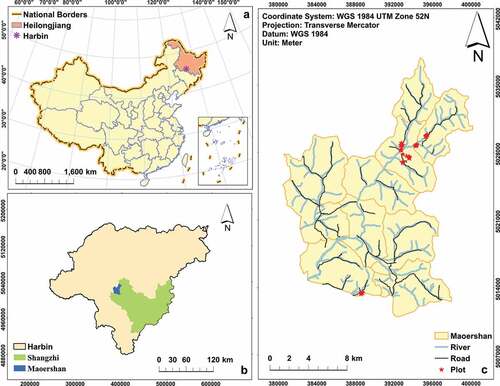
Table 1. The essential parameters of the three LiDAR data
Table 2. Descriptive statistics for individual tree parameters of all the 22 larch plantations plots, including tree height (H, m), diameter at breast height (DBH, cm) and aboveground biomass (AGB, kg)
Figure 2. The flowchart of nondestructive AGB estimation and spatial uncertainty analysis using both ITA and ABA from an individual tree- to stand-level based on multi-platform LiDAR and Landsat 8 OLI imagery. Module 1 was designed for the first objective: data registration and fusion, individual tree crown delineation, and the estimation of individual tree parameters. Module 2 was designed for the second objective: individual tree-level and plot-level AGB estimation and the uncertainty analysis of plot-level AGB using the MC simulation. Module 3 was designed for the third objective: pixel-level AGB estimation and its uncertainty using ITA and ABA, the stand-level AGB estimation and its uncertainty.
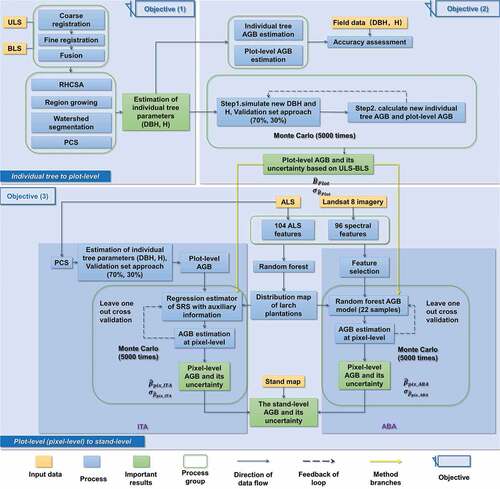
Figure 3. The MC procedures of pixel-level AGB estimation based on ITA and ABA. The pixel-level AGB and its uncertainty based on ITA (,
) was estimated with the regression estimator of SRS with auxiliary information and MC procedure; the pixel-level AGB and its uncertainty based on ABA (
,
) was estimated with the random forest and MC procedure.
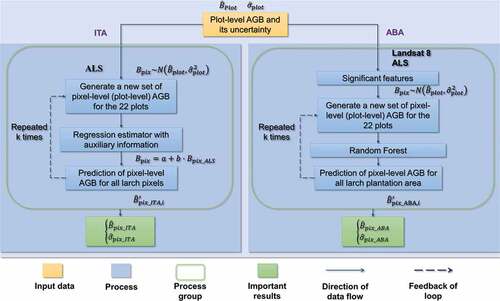
Table 3. The accuracy assessment for four ITCD algorithms at plot level
Table 4. The accuracy assessment of individual tree parameters based on different ITCD algorithms
Figure 4. The relationship of estimated and actual individual tree AGB based on PCS algorithm and ULS-BLS data (unit: kg). Note: the solid black line is a 1:1 line, and the red dot is the regression line.
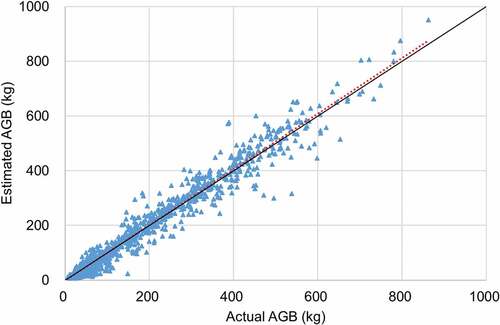
Figure 5. Relationship between plot-level actual AGB and estimated AGB aggregated by all detected trees (blue dot) and 1:1 matched trees (red triangle) using PCS and ULS-BLS. The accuracy indices of estimated AGB aggregated by all detected trees and 1:1 matched trees are showed in the blue and red dash rectangle, respectively.
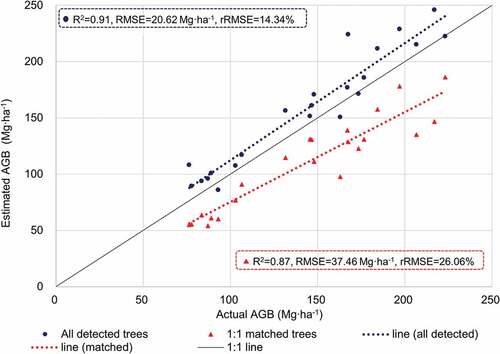
Table 5. The linear models of DBH and tree height fitted by the corresponding actual data
Table 6. The estimates of plot-level AGB and its uncertainty after MC simulation (Unit: Mg·ha−1)
Figure 6. Comparison of accuracies of pixel-level AGB estimates obtained by ALS data () and adjusted by the regression estimator (
) for the 22 plots of larch plantations (unit: Mg·ha−1). The accuracy indices of
and
are showed in the red and blue dash rectangle, respectively.
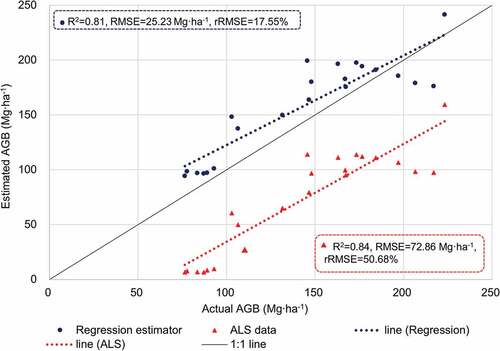
Figure 7. The spatial distribution of pixel-level AGB estimates () (a) and its uncertainty (
) (b) of larch plantations based on ITA around Xinken District. Xinken District was dominated by the AGB estimates and its uncertainty less than 180 Mg·ha−1 and less than 1 Mg·ha−1, respectively.
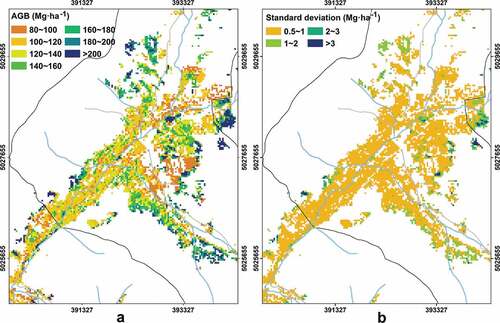
Figure 8. Relationship between pixel-level estimated and actual AGB of the 22 plots based on ABA. (unit: Mg·ha−1).
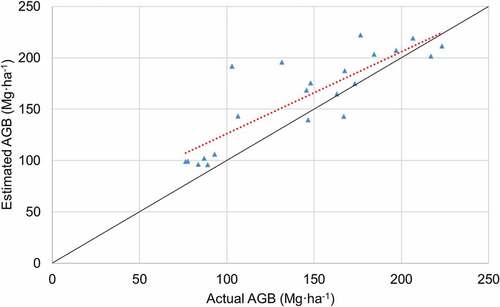
Figure 9. The spatial distribution of pixel-level AGB estimates () (a) and its uncertainty (
) (b) of larch plantations based on ABA around Xinken District. Xinken District was dominated by AGB estimates and its uncertainty less than 180 Mg·ha−1 and greater than 3 Mg·ha−1, respectively.
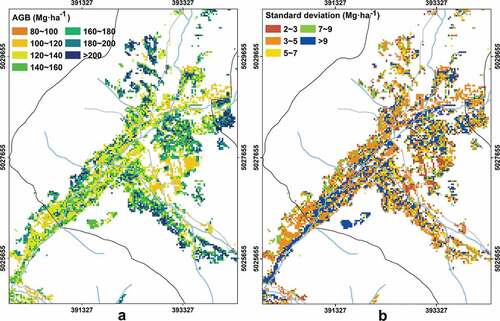
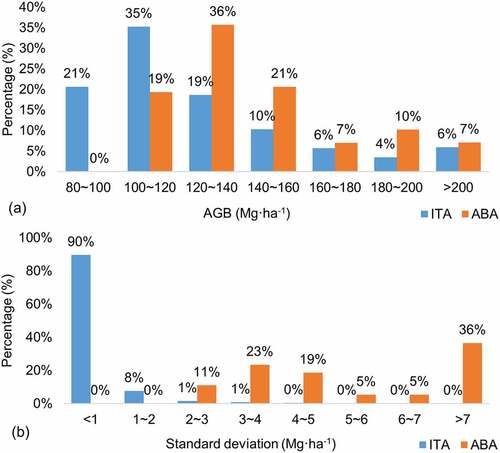
Figure 10. The histogram of pixel-level (a) AGB estimates and (b) its uncertainties with ITA and ABA. The ITA yielded a much wider range of AGB estimates and lower uncertainties than the ABA.
Data availability statement
The data that support the findings of this study are openly available in [figshare] at [10.6084/m9.figshare.17705627.v1]. The reference data are available on request from the corresponding author, (Y.Z).