Figures & data
Figure 1. Distribution types of the Offshore Island Connection Line (OICL).
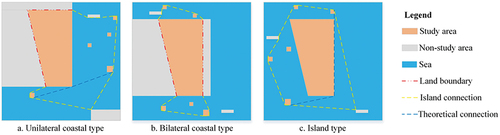
Figure 2. Research boundary of the study area (the Jinpu New Area).
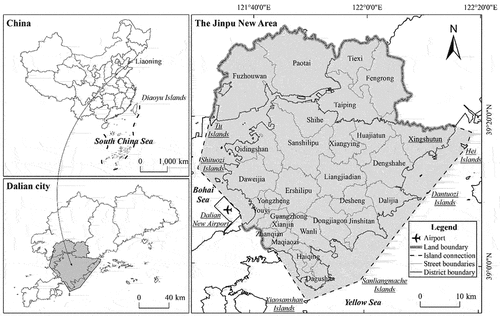
Figure 3. Research framework.
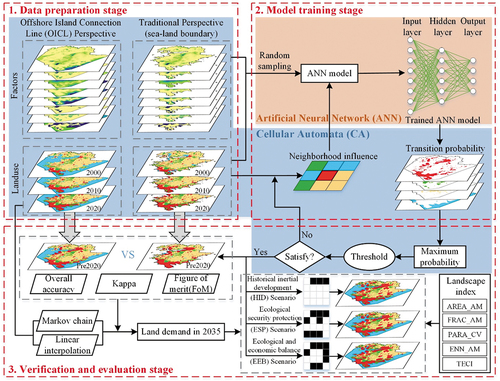
Table 1. Data source and description
Figure 4. Land use classification in 2000, 2010, and 2020 under traditional and OICL perspectives (2010 coastline as reference boundary).
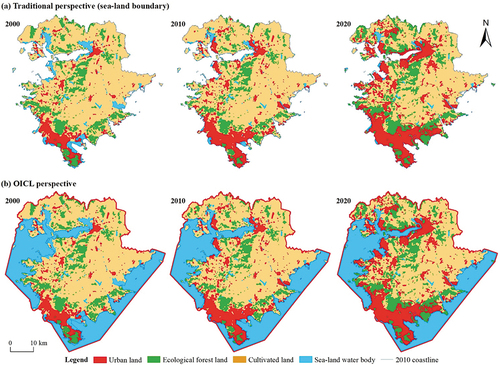
Table 2. Land use classification
Figure 5. Spatial distribution of eight influencing factors under traditional and OICL perspectives (see for the meanings of the labels and units).
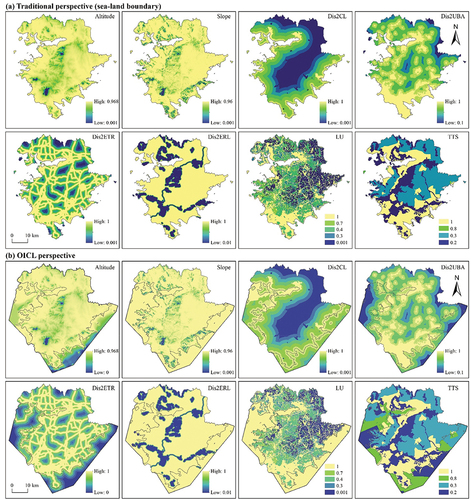
Figure 6. Boxplots of eight influencing factors under traditional and OICL perspectives (see for the meaning of the labels).
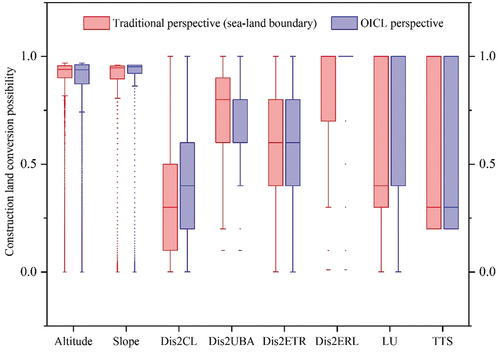
Table 3. Description of influencing factors
Figure 7. Real and simulated land use under traditional and OICL perspectives in 2020.
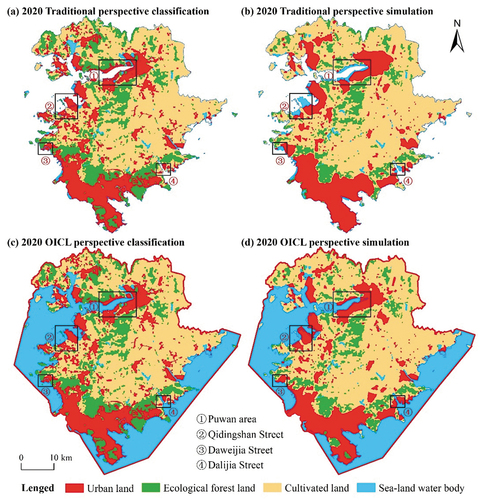
Table 4. Classification accuracy evaluation
Figure 8. Setting of the land use conversion matrix for HID, ESP, and EEB scenarios.
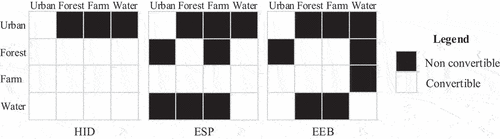
Figure 9. The 2035 land use patterns and the composition of new urban land under HID, ESP, and EEB scenarios.
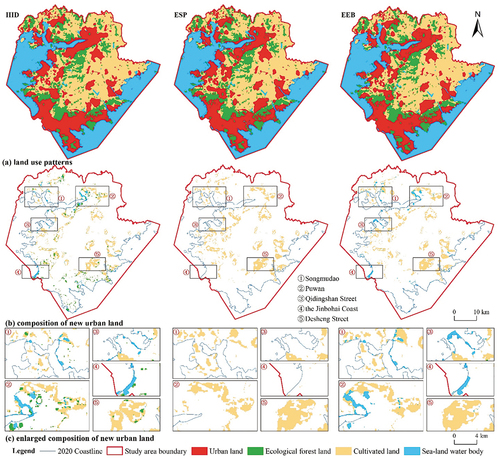
Table 5. Comparison of landscape pattern index of each scenario
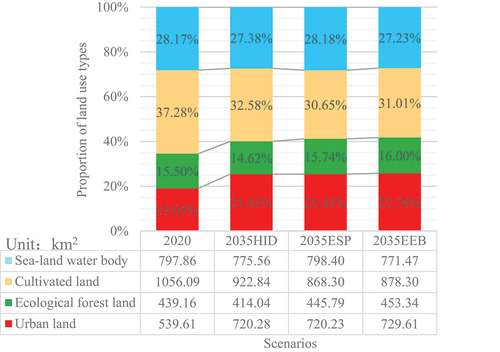
Figure 10. Area and proportion of land use types in 2020 and three scenarios of 2035.