
Figures & data
Table 1. Comparative table of the characteristics of satellite and UAV imagery.
Figure 1. Maps showing the location of (a) South Shetland Islands and most concretely, (b) Deception Island (Antarctica) and (c) the orthomosaic of the Vapor Col Chinstrap penguin colony generated with the UAV flight (RGB composite with bands Red-668 nm, Green-560 nm and Blue-475 nm, Micasense RedEdge-MX dual sensor achieving 6.04 cm/pixel size). (d-e) Pictures taken in the colony during the XXXIV Spanish Antarctic Campaign (February 2021) are also shown.
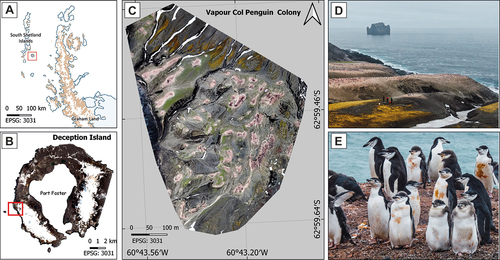
Figure 2. (a) Condor hexacopter used in this research. (b) Micasense RedEdge-MX dual multispectral camera. (c) Sentinel-2, Landsat 8 and Micasense RedEdge-MX spectral bands comparison.
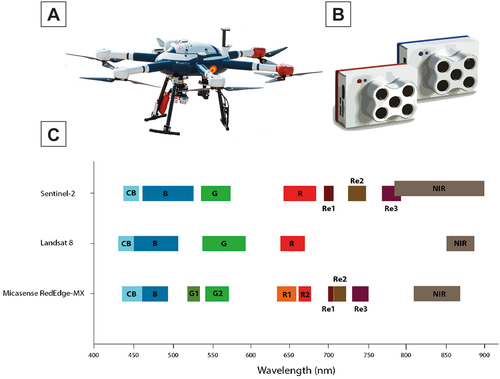
Table 2. Input variables selected for each image classification algorithm in SAGA GIS software.
Figure 3. Zoom of the Vapor Col penguin colony. MLC, SAC, RFC and SVM algorithms were applied to make the supervised classifications showed in the figure.
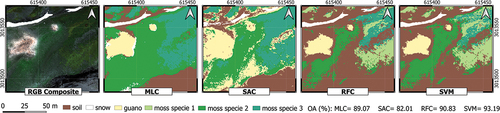
Table 3. Accuracy Assessment of thematic maps generated from UAV imagery using the four algorithms tested in this study (MLC, SAC, SVM and RFC), including user accuracy (“U-acc”), producer accuracy (“P-acc”), the OA (%) and the Cohen’s Kappa index.
Figure 4. SVM thematic maps obtained from the UAV, S2 (L1 and L2) and L8L2 imagery, with three highlighted regions of interest. In S2 (L1 and L2) and L8L2 RGB composite images, the area covered by the UAV in Vapor Col is indicated in yellow. Dates: UAV (8 February 2021), S2 (2 February 2021) and L8L2 (12 January 2021).
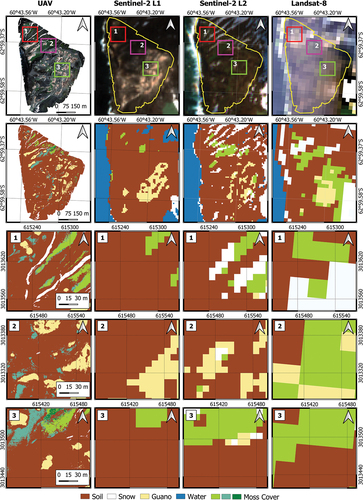
Figure 5. Land cover classes reflectance spectrum for each sensor (UAV, S2 (L1 and L2) and L8L2). It should be noted that in the case of the UAV, the vegetation substrate has three different classes. Wavelength (nm) is represented in the x-axis and reflectance (dimensionless) is represented in the y-axis.
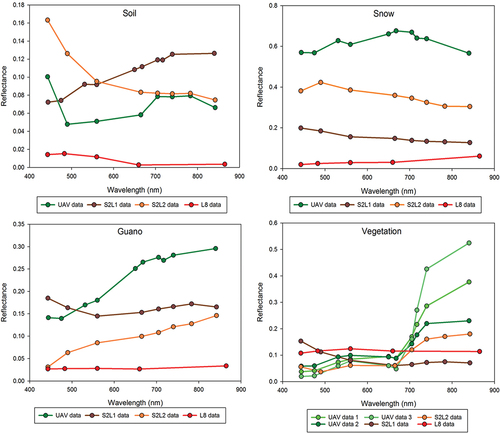
Figure 6. Pixel-by-pixel and band-by-band comparison of UAV surface reflectance data with S2 Level 2 atmospherically corrected product data (triangles) and with S2 Level 1 orthoimage product data (circles). Twenty pixels (n = 20) were selected in four different types of substrate: snow (gray color), guano (brownish color), soil (dark brown color) and vegetation (green color).
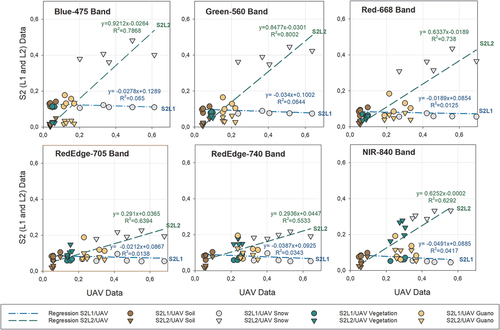
Table 4. Statistics calculated (R2, RMSE, MAE and bias) for the linear regression models applied to the relationships between the multispectral sensor equipped in the UAV and S2 (L1 vs L2) for comparison.
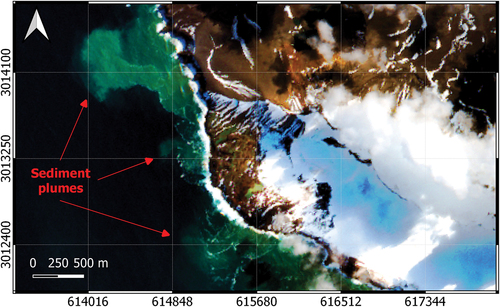
Figure 7. Sentinel-2 L2 true color composition on 2 February 2021, in which sediment plumes have been pointed out with red arrows.
Data Availability Statement
The authors confirm that the data supporting the findings of this study are available within the article [and/or] its supplementary materials.