
Figures & data
Figure 1. Map showing the spatial distribution of forest loss locations, training and test data across Ethiopia. The colors represent training and testing samples of one of the train-test split. The gray-lines are the boundaries of the study area, regions, and country.
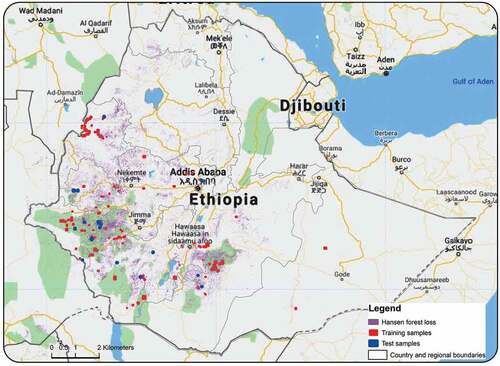
Figure 2. Figure For the same location in Ethiopia, (a) Planet-NICFI image, (b) Google earth engine image used for visual interpretation, (c) Hansen forest loss and, (d) manually annotated reference polygon. Example imagery and polygon were retrieved from Google Earth Engine
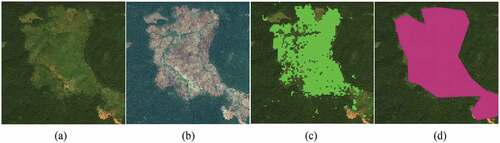
Figure 3. The training, validation, and test data showing the number of pixels per FLU (in %) of one of the random splits. Where SSCP, OLWTC, PF, LSCP, and TeaP correspond to small-scale cropland, Other land with tree cover, tree plantation, large-scale cropland, and tea plantation, respectively
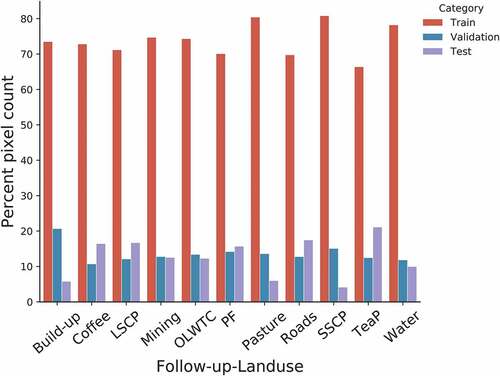
Figure 4. The classification F1-scores of FLU using standard U-Net, and Attention U-Net models in Ethiopia. SSCP and LSCP correspond to small-scale cropland and large-scale cropland, while Other-LWTC correspond to other land with tree cover. For each F1-score, we show the standard deviation represented as error bars.
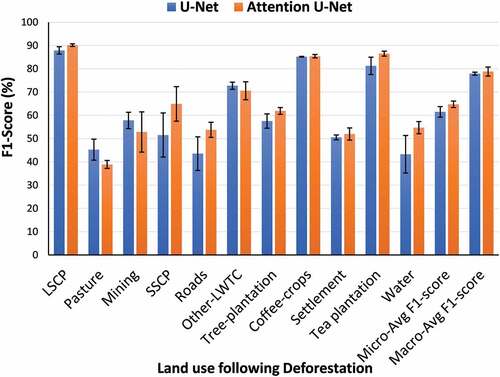
Figure 5. The classification F1-scores of FLU using Attention U-Net models in Ethiopia. The F1-scores are based on single-date, multi-date, and an ensemble of image predictions for Planet-NICFI, Sentinel-2 and Landsat-8 data. SSCP and LSCP correspond to small-scale cropland and large-scale cropland, while Other-LWTC correspond to other land with tree cover. The error bars are the standard deviation on F1-scores
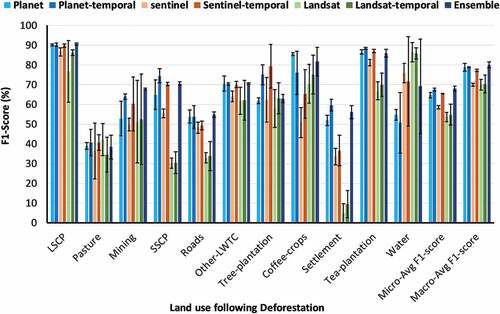
Figure 6. The classification F1-scores of FLU using for planet-NICFI images acquired in year 2016 and 2020. SSCP and LSCP correspond to small-scale cropland and large-scale cropland, while Other-LWTC correspond to other land with tree cover. The error bars are the standard deviation on F1-scores
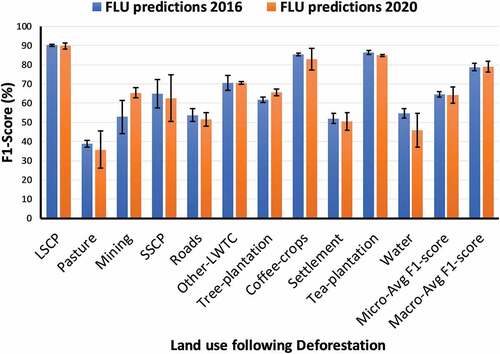
Table 1. Accuracy metrics of the wall-to-wall map from independently sampled validation data. SSCP and LSCP correspond to small-scale and large-scale cropland and PF for plantation forests. All the accuracies are reported as average values and 95% confidence intervals for each class.
Figure 7. Classified land-use post-deforestation for the Ethiopia tropical forest for the period 2010 through to 2014. The green in A is NDVI base map showing areas with forest cover as retrieved from USDA (Citation2017). Areas indicated by b, c, d, e, f, and g are shown in zoomed in maps. Zoomed in maps show local patterns of the follow-up land-use with planet-NICFI as a base map. (b) Coffee crops (teal), (c) Small-scale cropland (orange) and settlement (pink), (d) Roads (red), settlement and dam construction (pink) in the woodlands of Benishangul Gumuz, (e) Large-scale croplands (yellow), (f) small-scale croplands (orange), and (g) Tea plantations (cyan). New roads (red) as detected in (d), (e), (f), and (g) provides accessibility to patches of land-use. SSCP, LSCP, PF correspond to small-scale cropland, large-scale cropland, and tree plantation while OLWTC correspond to other land with tree cover
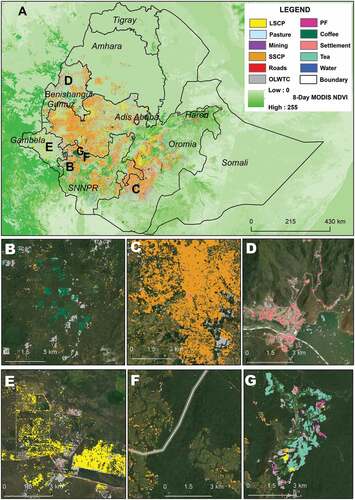
Figure 8. Proportions of post-deforestation land-use, (a) per region, and, (b) per forest type, for the Ethiopia tropical forest for the period 2010 through to 2014. SSCP correspond to small-scale cropland, LSCP to large-scale cropland, EMF to Ethiopia montane forests, MGS to montane grasslands and shrublands, TSGSS to tropical subtropical grasslands-savanna and shrublands, and DXS to Deserts and Xeric shrublands.
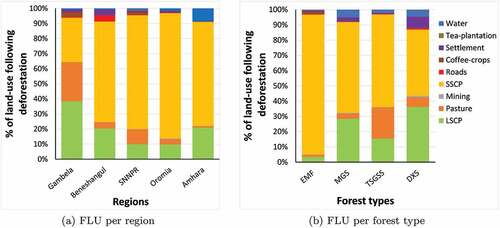
Figure A1. Schematic view of our U-net network for single-date images input. Inputs are tensors are of size i width j height
n bands. The colors represents, white = Input array, teal = Double 2D convolution operations, and cyan = output layer.
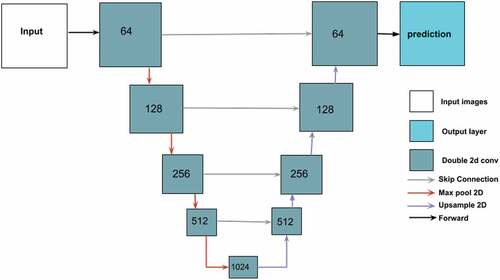
Figure A2. Schematic view of our Attention U-net network for single-date images input. Inputs are tensors are of size i width j height
n bands. The colors represents, white = Input array, teal = Double 2D convolution operations, red = Attention gate, and cyan = output layer.
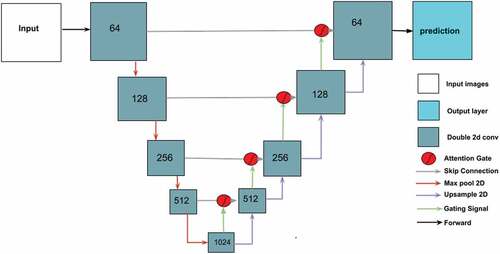
Figure A3. Schematic view of our Attention U-net network for multi-date images input. Inputs are tensors from four time steps (time 1 to time 4), each of size t time steps i width
j height
n bands. The model operates on a sequence of four input tensors, each composed of n bands. The network architecture automatically detect the useful features of the multiple input bands and combines this information for the following layers to predict the Land-use following deforestation. Note that this model setting is also useful to handle scenarios where either one of the input images are affected by clouds.
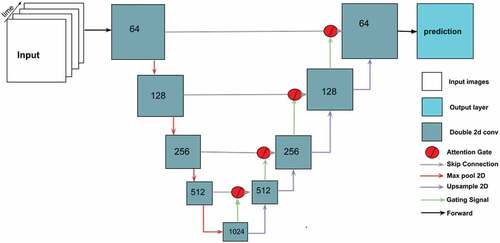
Table B1. Architecture of a standard U-Net, Attention U-Net, temporal Attention U-Net, and ensemble of multi-sensor Attention U-Net models
Figure C1. The flowchart showing the steps in data generation, modeling, map validation in our study.
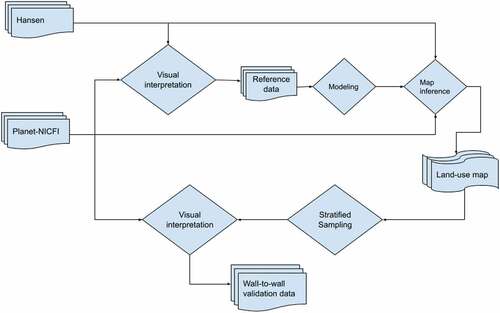
Figure D1. Spatial pattern of classified land-use following deforestation for the Ethiopia tropical forest for the period 2010 through to 2014. The map shows the follow-up land-use predicted using planet-NICFI image. Street map is used as a base map for display. SSCP and LSCP correspond to small-scale cropland and large-scale cropland, PF to tree plantation, and OLWTC to other land with tree cover.
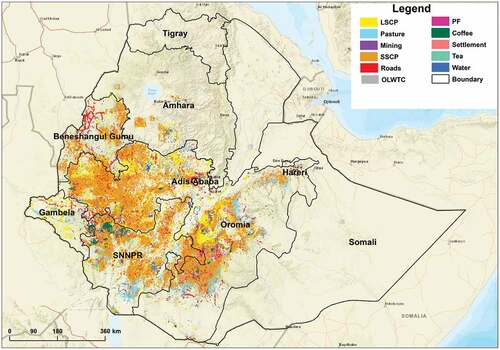
Figure D2. Represents the planet-NICFI images, showing how FLU evolves over time from deforestation. This is one of the patches of land-use following deforestation (large-scale cropland) in Ethiopia where changes happened over n-years, (a) Planet-NICFI image 2016, (b) Planet-NICFI image 2017, (c) Planet-NICFI image 2018 and, (d) the Planet-NICFI image 2020, respectively.
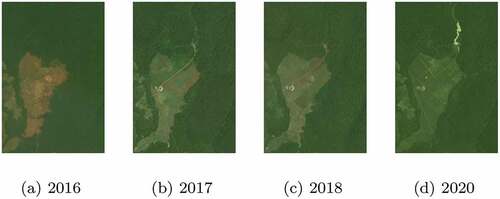
Figure D3. Classified land-use following deforestation for the Ethiopian tropical forest for the period 2010 through to 2014. Areas in orange color are the predicted small-scale clearing occurring at the edges of the forest. Roads in red color provides accessibility on new established patches of land-use following deforestation. SSCP and LSCP correspond to small-scale cropland and large-scale cropland, PF to tree plantation, and OLWTC to other land with tree cover.
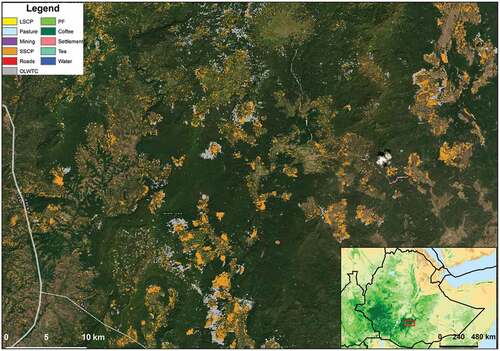
Figure D4. The percentage of true- and false predicted FLU’s using Attention U-Net deep learning method and Planet-NICFI images. SSCP and LSCP correspond to small-scale cropland and large-scale cropland, TP to tree plantation, TeaP to tea plantation, and OLWTC to other land with tree cover.
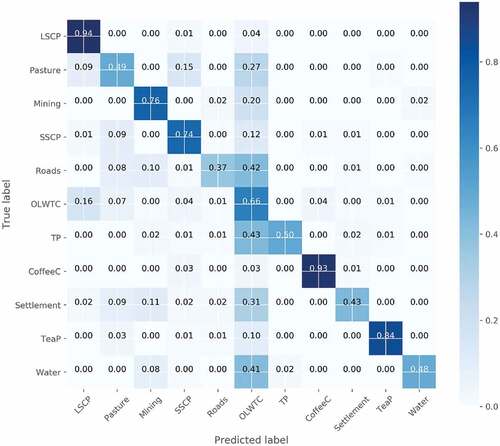
Figure E1. Visually interpreted data used for wall-to-wall validation of the land-use following deforestation product. SSCP and LSCP correspond to small-scale cropland and large-scale cropland, and OLWTC to other land with tree cover.
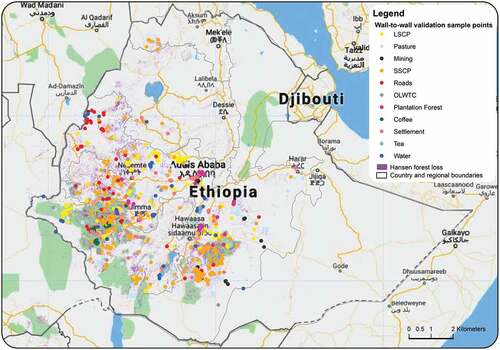
Table F1. The time for training and testing in minutes (m) of attention deep learning models using Planet-NICFI, Sentinel-2, and Landsat-8 datasets over a single-date, multi-date, and ensemble approach.