
Figures & data
Figure 1. Map of permafrost types and locations of ground temperature stations used in this study across China. The 2398 red points represent the ground surface temperature stations.
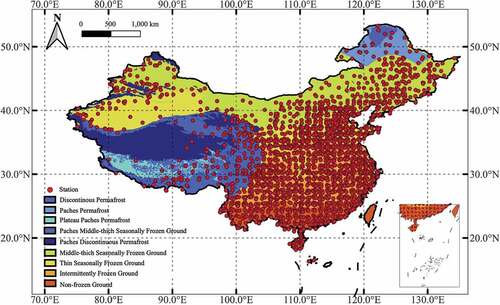
Figure 2. Flowchart of the KNORA-UNION algorithm used in this study.
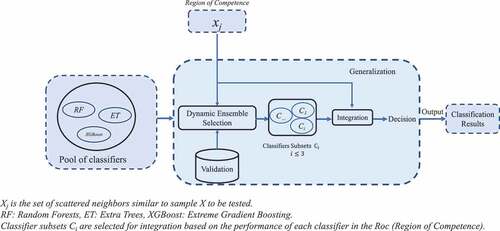
Figure 3. Comparison of six spectral classification indices of frozen soil, thawed soil, and desert: (a) Tb37V, (b) Tb22V, (c) PD, (d) SI, (e) SG, and (f) Tb22V-Tb91V.
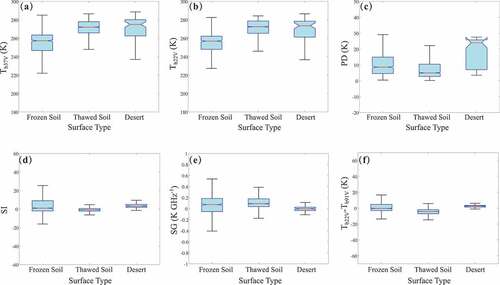
Figure 4. Spatial distributions of the FT prediction accuracy (%) for the (a) AM and (b) PM overpasses in 2011.
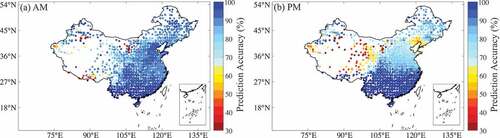
Figure 5. (a) Box plot of the FT prediction accuracy for the AM and PM overpasses from 2010 to 2016 and (b) mean prediction accuracy of daily FT-DESA classifications for the AM and PM overpasses.
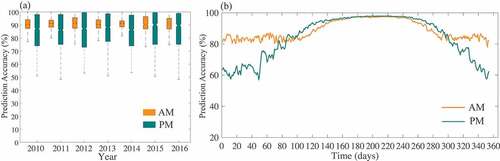
Figure 6. Spatial distributions of the surface FT state retrieved by the FT-DESA on the representative days in 2011 represent the seasonality.
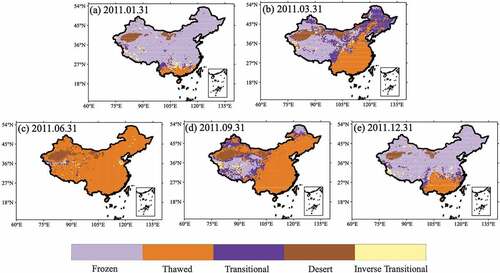
Figure 7. Spatial patterns of mean annual (a) tfreeze, (b) tthaw, and (c) Lthawed from 2009 to 2020 based on the FT-DESA retrieval.
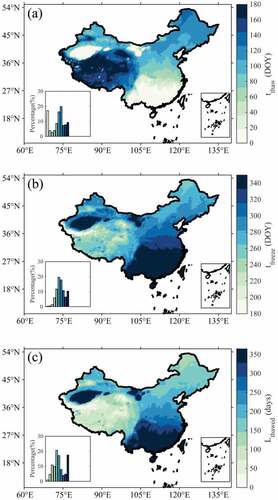
Figure 8. Spatial distributions of mean annual (a-e) tthaw, (f-j) tfreeze, and (k-o) Lthawed for observations and the PM overpass results of four FT algorithms: FT-DESA, MSTA, DTA, and DIA.
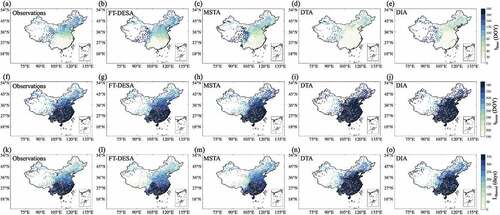
Figure 9. Spatial distributions of mean biases (retrieval-observation) of (a-d) tthaw, (e-h) tfreeze, and (i-l) Lthawed for the PM overpass results of four FT algorithms: FT-DESA, MSTA, DTA, and DIA.
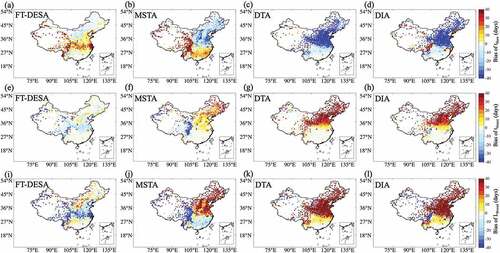
Table 1. Statistical metrics (bias and standard deviation (σ)) of the four algorithms in tthaw, tfreeze and Lthawed of surface soil frozen status.
Figure 10. Box bars of biases (retrieval-observation) of (a) tthaw, (b) tfreeze, (c) Lthawed for four FT algorithms.
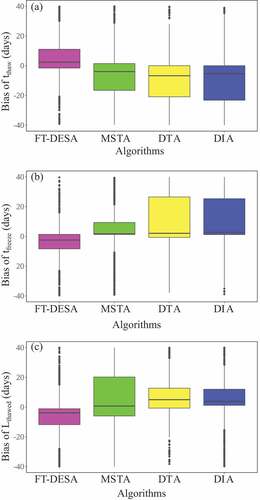
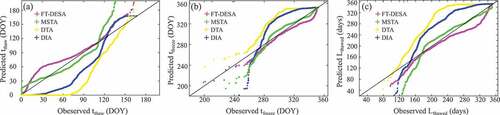
Figure 11. Quantile–quantile plots of the retrieved (a) tthaw, (b) tfreeze, and (c) Lthawed by four FT algorithms vs. observations.
Data availability statement
The SSMIS brightness temperature data are available from the Remote Sensing Systems (http://www.remss.com/). The observed ground temperature is available from the Daily Data Set of Basic Meteorological Elements of National Surface Meteorological Stations in China (V3.0) (https://data.tpdc.ac.cn/). The land-use data are available from the Resource and Environment Science and Data Center (http://www.resdc.cn/). The permafrost map is available from the Resource and Environment Science and Data Center (http://www.resdc.cn/). The dual-index algorithm (DIA) (2009-2015) is released by National Tibetan Plateau Data Center (https://data.tpdc.ac.cn/). The modified seasonal threshold algorithm (MSTA) (2009-2015) is released by the American Snow and Ice Data Center (https://nsidc.org). The source code of the KNORA-UNION dynamic ensemble selection algorithm is available from https://github.com/scikit-learn-contrib/DESlib/tree/master/deslib/des/.