
Figures & data
Figure 1. Comparisons of urban entities with the LandScan population product and Landsat images in 2015.
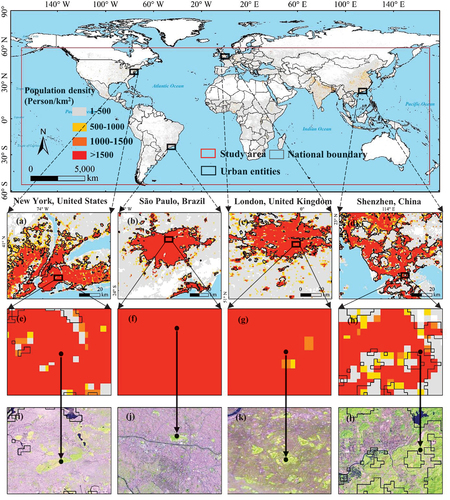
Figure 2. Comparisons of urban entities with road networks in different cities of China in 2015.
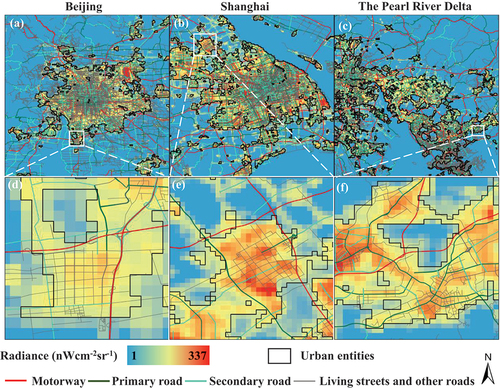
Figure 3. Regression comparisons of total areas from urban entities with those from HE and MODIS at the national level from 2000 to 2020. Note: HE represents urban built-up areas proposed by He et al. (Citation2019); MODIS represents artificial impervious extents collected from the data product of MODIS Land Cover Type Version 6. Below are all the same abbreviations.
Figure 4. Comparisons of total areas from urban entities with those from MODIS and HE at the global and continental levels.
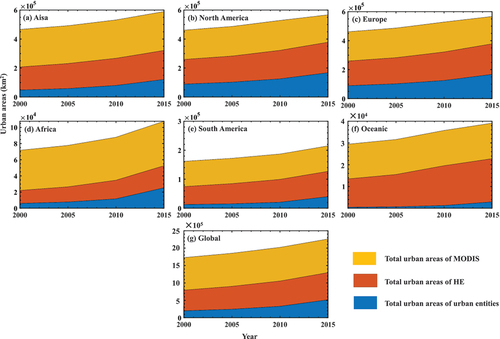
Figure 5. Spatial comparisons of urban entities, MODIS, and HE with the LandScan population product in 2015.
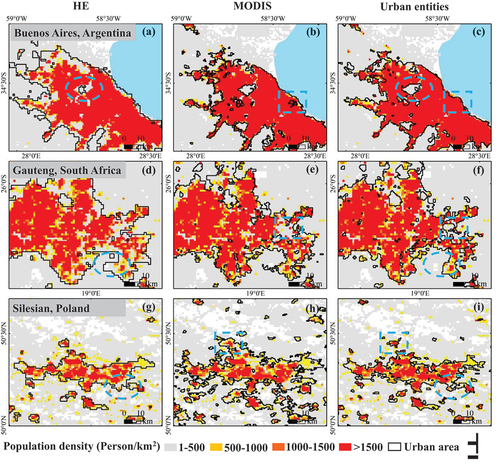
Figure 6. Correlations of total areas of urban entities, MODIS, and HE with urban population density at the national level.
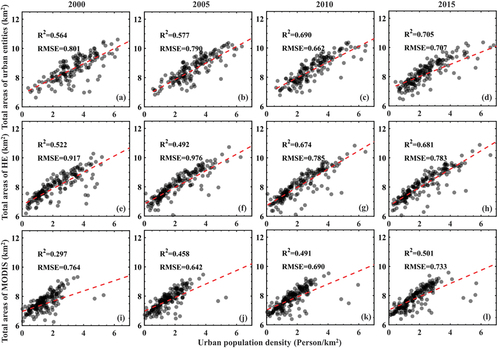
Figure 7. Global urban entity expansion from 2000 to 2020. Note: (b)-(e) urban entity expansion patterns of sample cities located in different continents; (g)-(f) urban entity expansion by longitude and latitude.
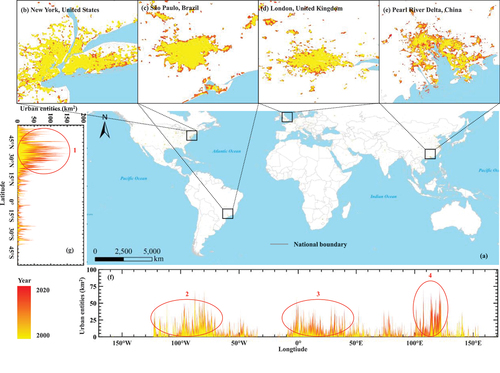
Figure 8. Urban entity expansion at the continental level. Note: (a) urban entities; (b) per capita urban entities.
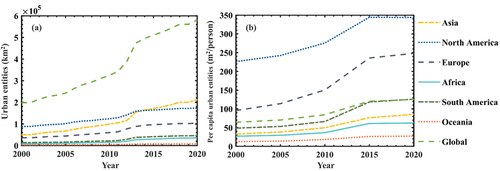
Figure 9. Urban entity expansion at the national level. Note: (a) urban entities in 2020; (b) per capita urban entities in 2020; (c) urban entities in 20 typical countries; (d) per capita urban entities in 20 typical countries.
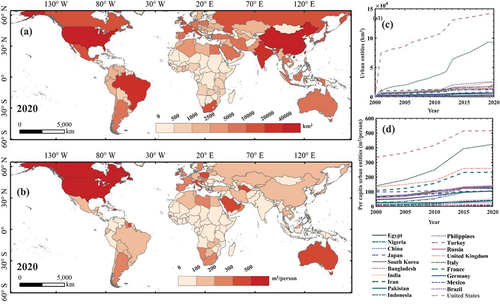
Figure 10. Spatial visual differences of NTL, developed land, and Landsat images in 2010.
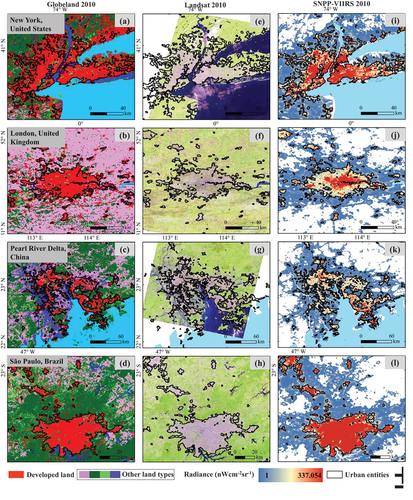
Figure 11. Comparisons among urban entities identified using different approaches. Note: Urban entities identified by (a) the reference-based threshold method, (b) integrating NTL and VI, (c) integrating NTL and LST, and (d) integrating NTL, VI, and LST; (e) and (f) Landsat and LandScan images, respectively. Note: NTL, VI, and LST represent nighttime light data, terra vegetation index, and terra land surface temperature, respectively.
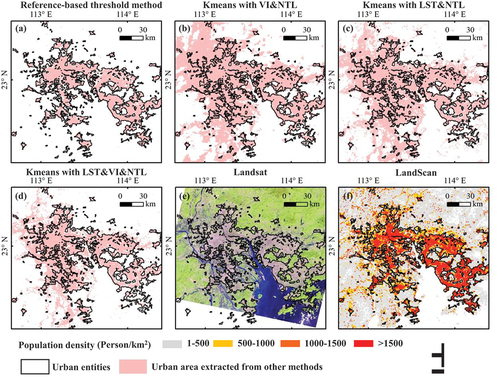
Figure 12. Brightness thresholds of urban entities. Note: (a) Global and continent; (b) developing country; (c) developed country.
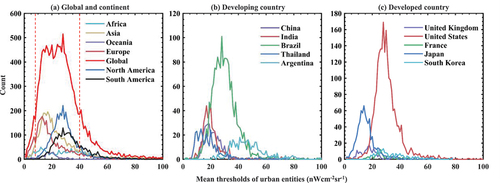
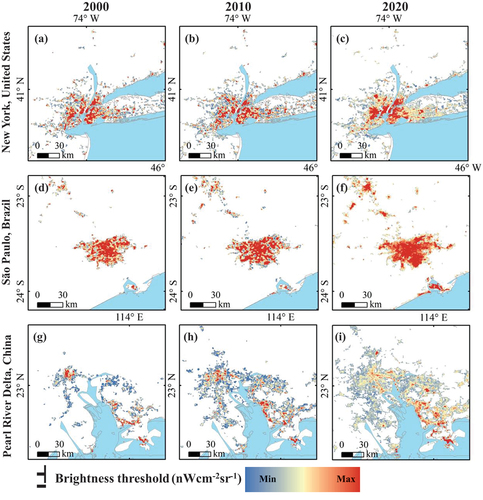
Figure 13. Brightness thresholds within typical cities in different continents.
Supplemental Material
Download MS Word (4.2 MB)Data Availability Statement
Global urban entities (2000–2020) can be downloaded https://dataverse.harvard.edu/dataset.xhtml?persistentId=doi:10.7910/DVN/79CRQJ. The newly generated SNPP-VIIRS-like data are openly available in Harvard Dataverse at https://dataverse.harvard.edu/dataset.xhtml?persistentId=doi:10.7910/DVN/YGIVCD#. Population was extracted from the LandScan datasets. Artificial impervious extents collected from the data product of MODIS Land Cover Type Version 6 and urban built-up areas proposed by He et al. (Citation2019). Terra land surface temperature, Terra vegetation index, Terra land water, and Landsat 8 OLI, were obtained from the Google Earth Engine platform. The 2010 developed land was acquired from GlobeLand30. Road networks were extracted from OpenStreetMap. Statistical data, including urban population and GDP, were obtained from the United Nations and World Bank, respectively. Administrative boundaries were collected from Natural Earth.