
Figures & data
Figure 1. Map of Shanxi Province and data coverage. Sentinel-1 frames are delineated with blue boxes; expressway network is shown in grey line; orange and red dots are the location of subsidence/fissure and landslide, respectively; and the purple triangle denotes the location of GNSS station.
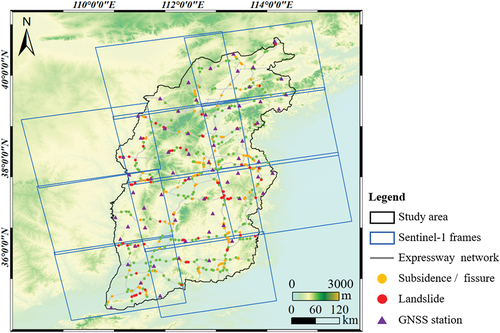
Table 1. Detailed data information of SAR acquisitions.
Figure 2. Flow chart of the stacking workflow used in this study. SLC: single-look complex; MCF: minimum cost flow; SCWU: Supercomputing center of Wuhan University.
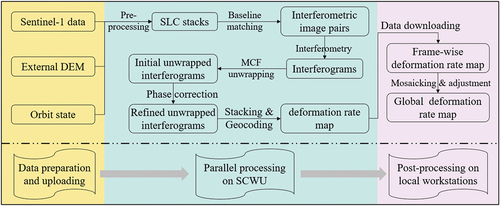
Figure 3. Comparison of deformation rate before and after mosaicking and adjustment. Left column is the location indicator of the zoom-ins; A.Before and B.Before are the deformation rate before mosaicking and adjustment; A.After and B.After are the deformation rate after mosaicking and adjustment.
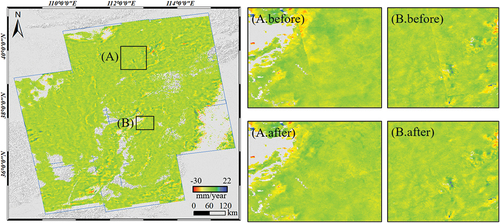
Figure 4. Factors of geohazards assessed in the binary logistic regression. a. Random hazard points. b. Deformation rate. c. Elevation. d. Gradient. e. Annual precipitation. f. Bedrock hardness. g. Stream distribution. h. Fault distribution. i. Traffic load.
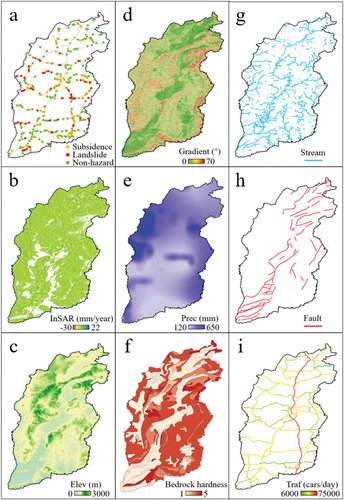
Table 2. Detailed data information and preparation strategy.
Figure 5. Deformation rate map of Shanxi Province. Negative value represents subsiding, positive value represents uplifting.
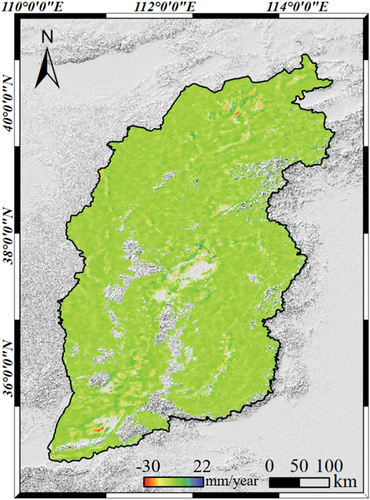
Figure 6. Deformation rate map of the expressway network in Shanxi Province. Negative value represents subsiding, positive value represents uplifting.
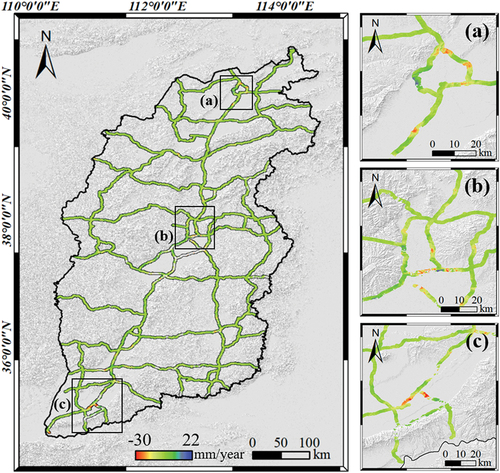
Figure 7. Comparison between InSAR results and GNSS data.
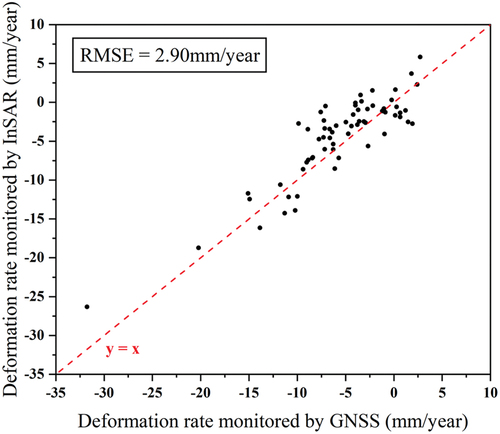
Figure 8. Results of the binary logistic regression analysis for the eight factors. a. Deformation rate. b. Elevation. c. Gradient. d. Annual precipitation. e. Bedrock hardness. f. Distance to stream. g. Distance to fault. h. Traffic load. VIF: variance inflation factor; sig: significance.
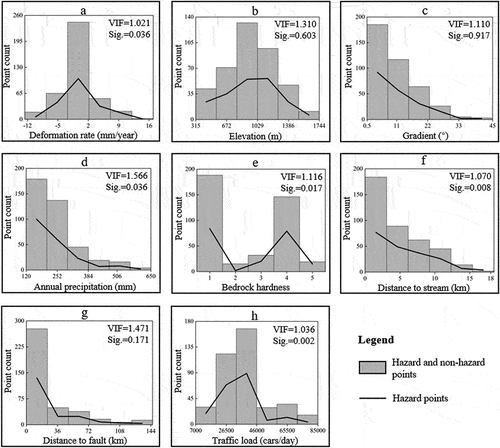
Table 3. Statistical table of pixel count and percentage in each deformation rate interval.
Data availability statement
Sentinel-1 SAR data can be downloaded from https://scihub.copernicus.eu/; Orbit state data can be downloaded from https://s1qc.asf.alaska.edu/aux_poeorb/; And ALOS PRISM DEM data can be downloaded from https://asf.alaska.edu/; The precipitation data is obtained from National Tibetan Plateau Data Center (http://www.ngac.org.cn/); The bedrock hardness and fault map are obtained from the 1:200000 geological map from National geological archives of China (http://www.tpdc.ac.cn/).