
Figures & data
Figure 1. Land cover distributions in Bothaville and Harrismith (orange and red squares), Free State province (dark grey), South Africa (adopted from Kganyago Citation2022). The insert maps are projected to UTM (Universal Transverse Mercator) with WGS-84 (World geodetic System 1984) Datum. The land cover dataset was obtained from the Department of Forestry, Fisheries and the Environment (https://egis.environment.gov.za/gis_data_downloads, accessed 20 March 2021).
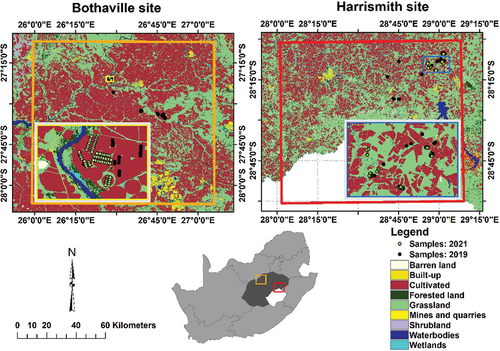
Figure 2. The schematic representation of the methods used in this study. Five experimental scenarios, i.e. Spectral bands (SB), SB and Angles (SB + Angles), Spectral vegetation indices (SVIs), SVIs and Angles (SVIs + Angles), and All variables (Avar) were used for crop biophysical and biochemical variable (BV) retrieval using two test datasets, i.e. cross-validation test dataset and an independent held-out test (i.e. unseen) dataset.
Figure 3. Spatial (per-pixel) variation of Sentinel-2 illumination and view angles over the two study sites, i.e. Bothaville (a–c) and Harrismith (d–f). (a) and (d) show per-pixel Sun Zenith Angle (SZA), (b) and (e) show per-pixel mean View Zenith Angle (VZA), and (c) and (f) show per-pixel mean Relative Azimuth Angle (RAA).
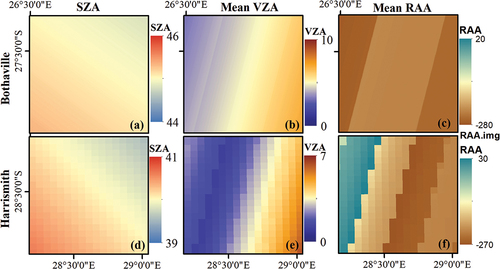
Figure 4. Summary statistics Sentinel-2 illumination and view angles in Bothaville (a–c) and Harrismith (d–f). The red line indicates the mean value for each geometric variable over 50,000 randomly sampled pixels.
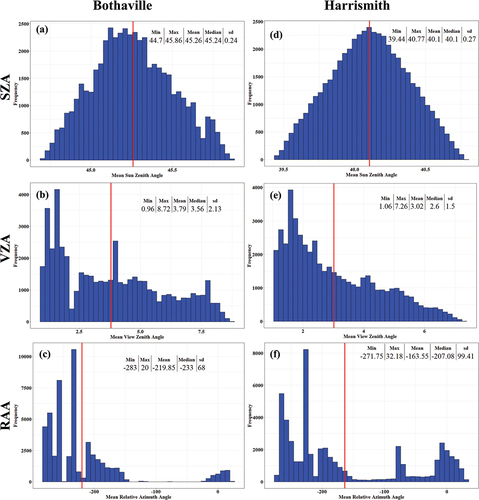
Table 1. The various experimental scenarios were designed by excluding and including view and illumination geometry from commonly used radiometric inputs (i.e. spectral bands and vegetation indices).
Table 2. The red-edge indices from Sentinel-2 MSI data.
Table 3. The amount of spectral variability explained by the geometric variables based on multiple linear regression.
Table 4. The performance of various Sentinel-2 input variables in retrieving various crop parameters using Random Forest (RF) with two test datasets, i.e. cross-validation data pooled from the two sites and independent test data from Harrismith (in brackets).
Figure 5. Scatterplots for the best Random Forest (RF) models for retrieving various BVs using various Sentinel-2 covariates, cross-validation test dataset pooled from Bothaville and Harrismith (i.e. a–c) and an independent held-out (i.e. 30%) dataset from Harrismith (i.e. d–f). SB + Angles achieved the best LAI and CCC predictive accuracy with cross-validation test datasets (i.e. a and c), while SVIs + Angles resulted in superior predictive accuracy for LCab with both test datasets (i.e. b and e), and for LAI with the Independent held-out (i.e. 30%) dataset (i.e. d). Avar achieved superior predictive accuracy for CCC with the independent held-out dataset (i.e. f).
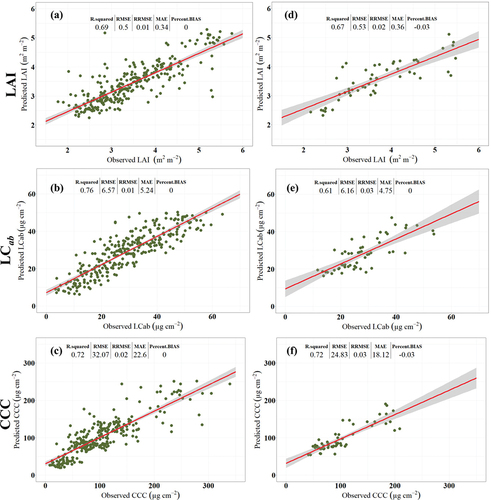
Figure 6. Spatial distribution of crop biophysical and biochemical variables for Bothaville (a–c) and Harrismith (d–f). The LAI and CCC maps in (a) and (c) were achieved with SB + Angles, while LCab in (b) and (e) SVIs + Angles. Avar was used to map CCC in (f).
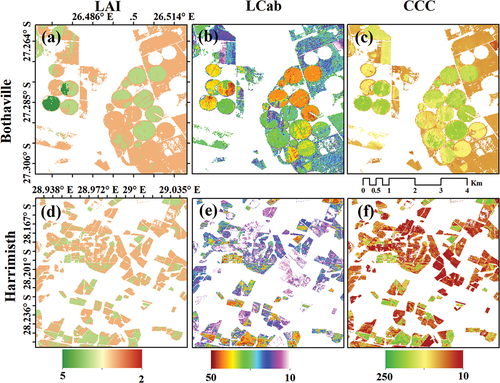
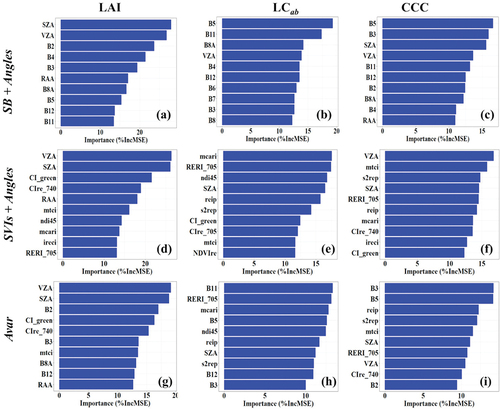
Figure 7. Top 10 important variables (high to low) for retrieving LAI, LCab, and CCC using each experimental scenario identified with Random Forest (RF) and fivefold cross-validation with 100 iterations.
Supplemental Material
Download MS Word (7.7 MB)Data availability statement
The data that support the findings of this study are available from the corresponding author, MK, upon reasonable request.