
Figures & data
Figure 1. Study area; (a-c) show the geographical location of the study area and the phenological observation sites; (d) is a Landsat 8 OLI false-color composite (R: NIR band, G: red band, B: green band) acquired on 15 December 2019.
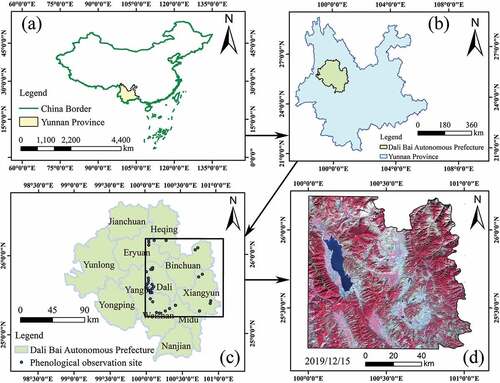
Figure 2. Field photos of common dominant tree species groups in the study area.
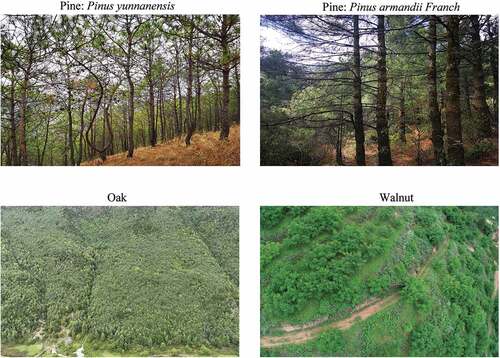
Figure 3. Flowchart of this study.
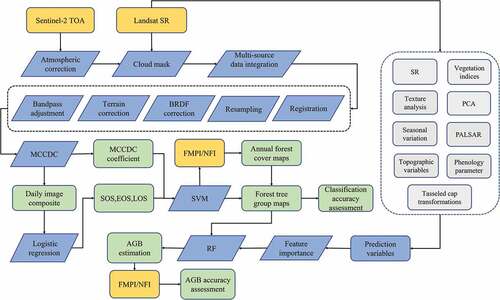
Figure 4. Spectral characteristics of different dominant tree species over time characterized by the MCCDC coefficients.
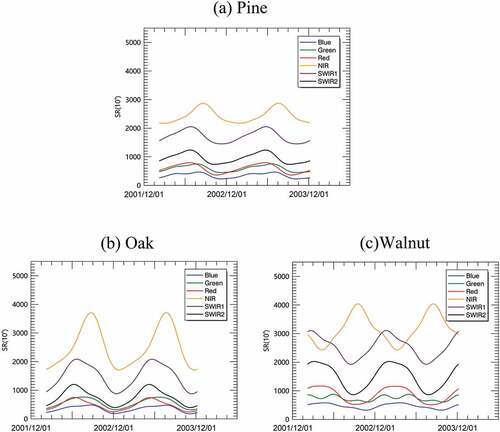
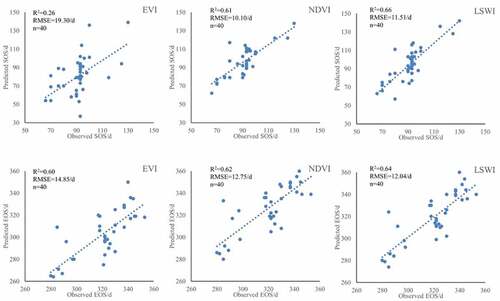
Figure 5. Comparison of the phenological parameters of different dominant tree species groups.
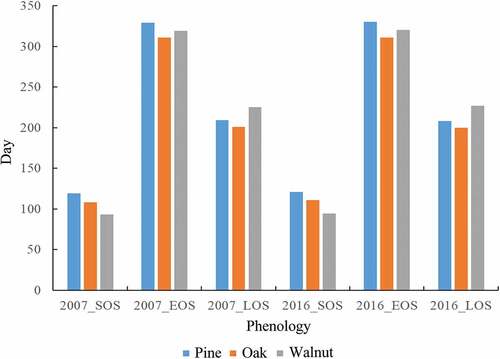
Table 1. Predictor variables for AGB modeling.
Table 2. Accuracy and confidence interval of the dominant tree species groups obtained from the model with only spectral variables in 2007 and 2016 (confidence level = 95%).
Table 3. Accuracy and confidence interval of the dominant tree species groups obtained from the model with the MCCDC coefficients and phenological parameters in 2007 and 2016 (confidence level = 95%).
Figure 6. Spatiotemporal distribution of the dominant tree species groups obtained from the model with the MCCDC coefficients and phenological parameters.
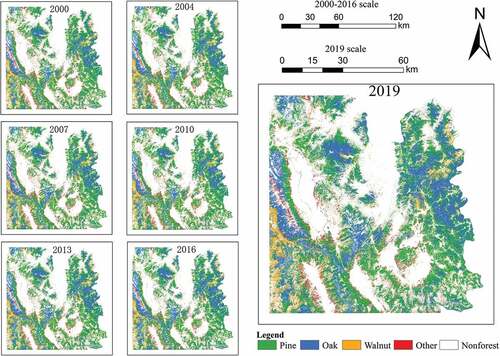
Figure 7. Percentage of different dominant tree species groups from 2000 to 2019.
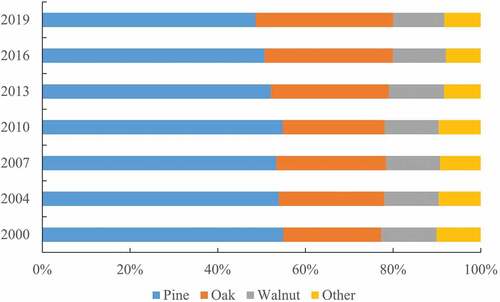
Figure 8. Variable importance ranking of the predictor variables.
Table 4. Evaluation indices of models with different variable combinations.
Table 5. AGB accuracy of the proposed AGB model for different dominant tree species.
Figure 9. Scatter plot of predicted and observed AGB; (a) without considering dominant tree species and (b) considering dominant tree species. * indicates significant differences in the predicted AGB between (a) and (b).
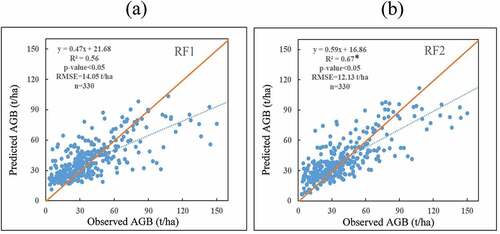
Figure 10. Spatial distribution of forest AGB from 2000 to 2019.
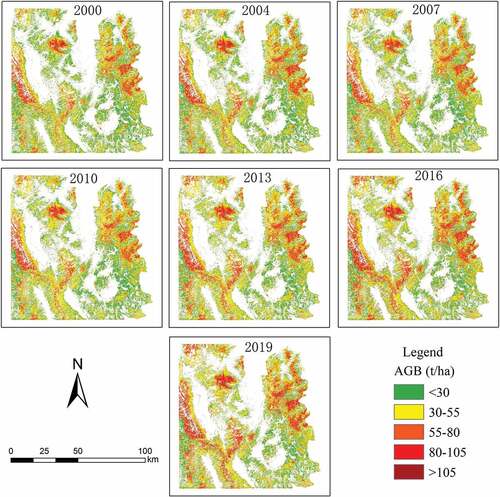
Figure 11. AGB statistics from 2000 to 2019.
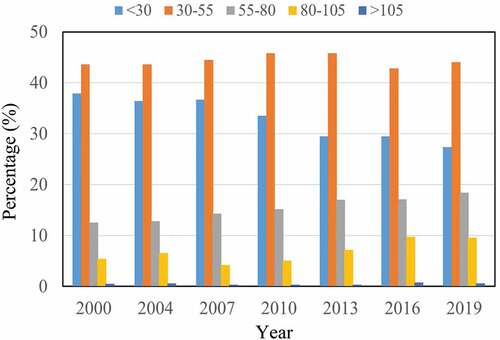
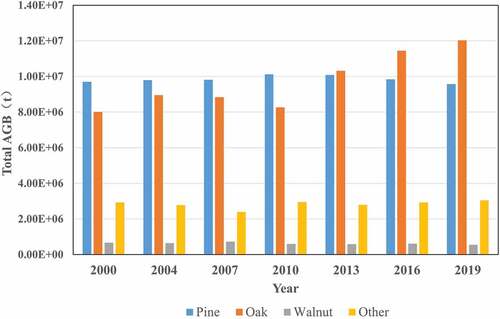
Figure 12. Total AGB of different dominant tree species from 2000 to 2019.
Data availability statement
The data that support the findings of this study (i.e. the land cover and probability maps) are available from the corresponding author and USGS (https://glovis.usgs.gov/).