
Figures & data
Figure 1. (a) Study area and distribution of rapeseed phenological calendar. (b) Phenological calendar of rapeseed in four typical sites. “E, “M,” and “L” represent the early, middle, and late periods of the month, respectively.
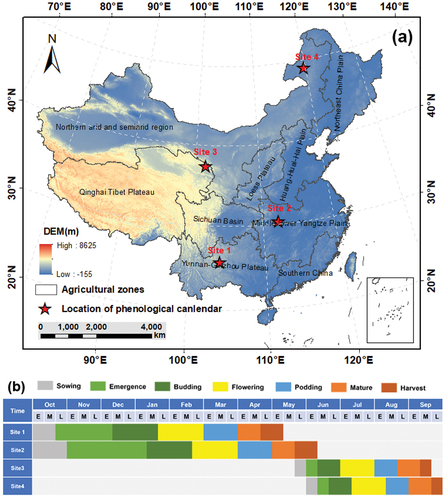
Figure 2. The locations of ground truth data. (b) to (d) are the distributions of validated parcels obtained by field campaigns in Qinghai, Sichuan, and Qujing. (e) to (g) are rapeseed maps interpreted from very high-resolution images acquired during the flowering period in Taizhou, Jingzhou, and Lincang.
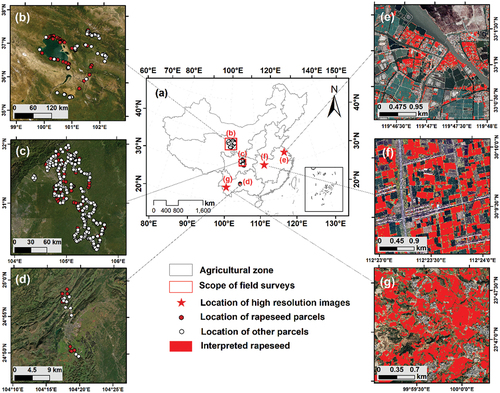
Figure 3. Flowchart of the proposed method. (a) Data preprocessing, (b) sample generation, (c) feature composition, (d) sample augmentation, and (e) PUL-RF classification.
Figure 4. Temporal features of rapeseed and other crops. One parcel of each crop was selected for analysis. (a) Winter rapeseed, (b) winter wheat, and (c) water field in Jingzhou; (d) spring rapeseed, (e) barley, and (f) corn in Qinghai. The red dashed line indicates that the time when the DYI reaches a maximum is equal to the time when the NDVI reaches a minimum; the black dashed line is the threshold of the NDVI and LSWI.
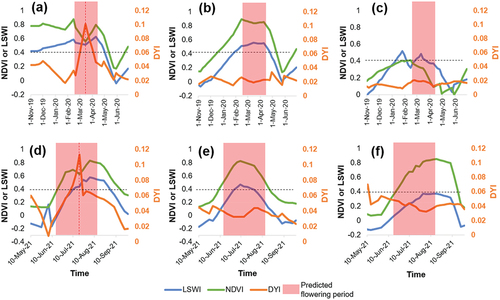
Figure 5. Schematic diagram of (a) feature composition and (b) sample augmentation.
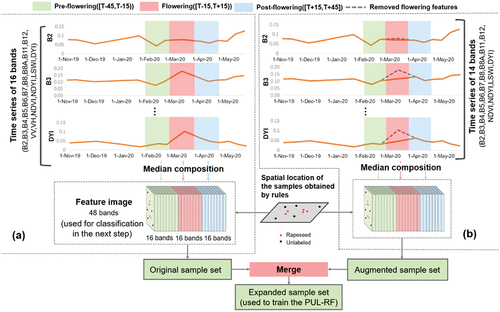
Figure 6. (A) Spatial distribution of generated rapeseed samples; (b) Number of generated rapeseed samples for 2019–2021.
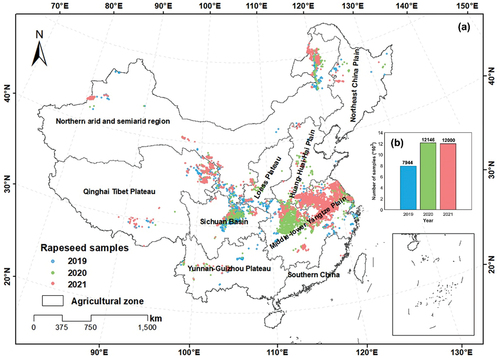
Figure 7. (a) Chinese rapeseed coverage map at 500 m resolution in 2020 (the original 20 m resolution was resampled to 500 m resolution for a better illustration in the thumbnail figure); (b) China rapeseed mapping area and census area, 2017–2021 (Note: census area in 2021 is unavailable).
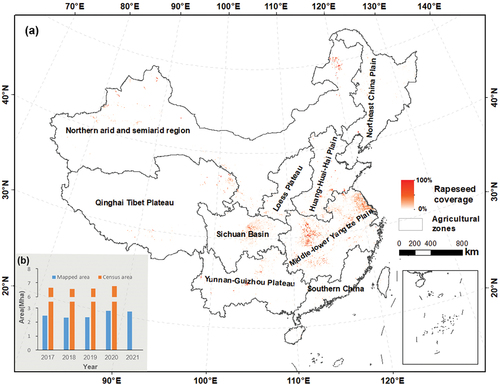
Figure 8. Detailed comparison of multiyear mapping results in 4 typical rapeseed planting areas. (a) Jingzhou, (b) Qujing, (c) Hulun Buir, (d) Qinghai. The first line in each region is the Sentinel-2 true color images, and the second line of each area is the mapped rapeseed. Images with ‘*’ after the annotated date were acquired in the nonflowering period.
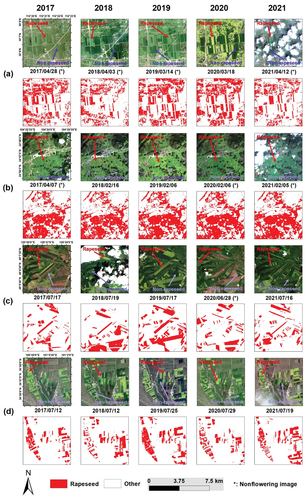
Figure 9. Comparison of the mapping details of the four methods in the validation areas (a) Jingzhou, (b) Taizhou, (c) Lincang, (d) Sichuan, (e) Qujing, and (f) Qinghai. The first column shows the RGB images of Sentinel-2 during the flowering periods in the validation areas except for Sichuan area, where the flowering images were totally cloud contaminated and the image acquired after flowering was shown instead. The second column shows the ground truth maps, which were interpreted from very high-resolution images for (a-c) and obtained from field-survey for (d-f). Columns 3 to 6 show the mapping details of CI, NDYI, SARM, and proposed RSG-OC respectively.
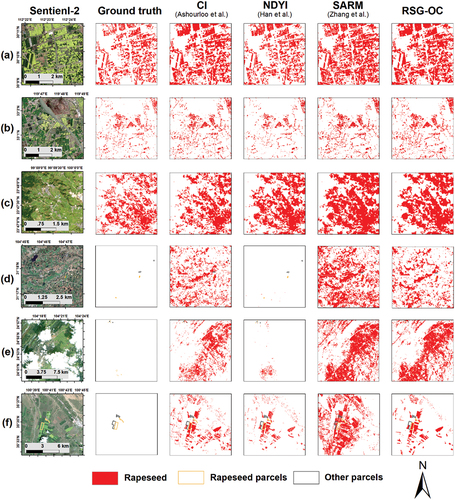
Figure 10. Comparison mapped rapeseed area with census area at the provincial level for (a)2017, (b)2018, (c)2019, (d)2020.
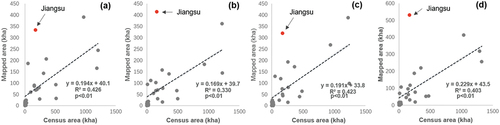
Table 1. Comparison of the accuracy of the four methods.
Figure 11. The sensitivity of the different methods to clear observation in the flowering period.
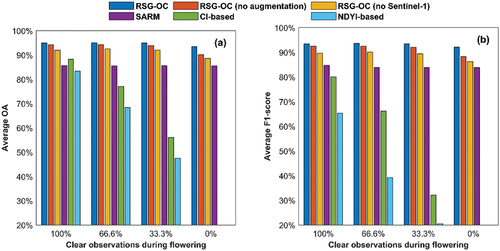
Figure 12. Ranking of the feature importance in (a) RSG-OC without sample augmentation and (b) standard RSG-OC. The subscripts after the features indicate the period of feature composition. “pre” represents the “preflowering” period, “flower” represents the “flowering” period, and “post” represents the “postflowering” period.
Figure 13. The WRI and DYI time series of (a) barley, (b) grass in Qinghai and (c) evergreen forest in Sichuan. The time series was selected from one typical parcel for each crop type.
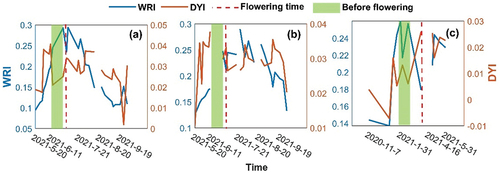
Figure 14. The variation of (a) number of pixels satisfying the sample selection rules, (b) Arapeseed, and (c) accuracy with DDYI threshold.
Figure 15. Comparison of (a) average OA and (b) average F1-score before and after excluding the 2020 and 2021 training samples.
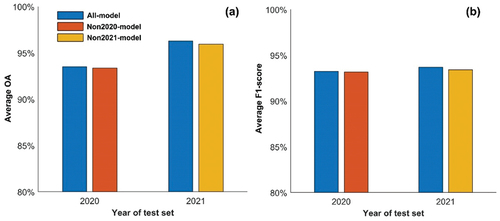
Figure 16. (a) Relationship between predicted flowering date and actual flowering date. (b) Distribution of errors in predicting flowering date. (c) Effect of bias in predicted flowering date on classification accuracy.
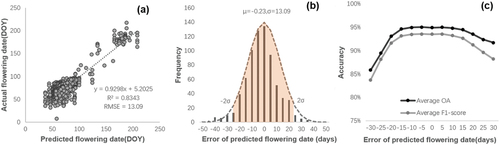
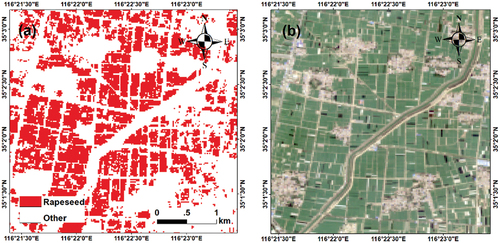
Figure 17. Example of misclassified rapeseed fields (35.04N, 116.37E) without yellowness in flowering season. (a) classification map, (b) true color image in flowering season.
Supplemental Material
Download MS Word (396.2 KB)Data availability statement
The Sentinel data (Sentinel-1, Sentinel-2 L2A, Sentinel-2 L1C) used in this paper are available in GEE; The produced rapeseed maps are also shared in GEE (https://code.earthengine.google.com/b457540737690943e0f0ac1d7dd41ed6) and Zenodo (https://doi.org/10.5281/zenodo.7047270). The processing code is available at (https://code.earthengine.google.com/7e7484b3ca4d9d1bd5896956c9c45ddc).
The validation data in this study are available from the corresponding author, X.H.Chen, upon reasonable request.