
Figures & data
Figure 1. Flowchart of this study.
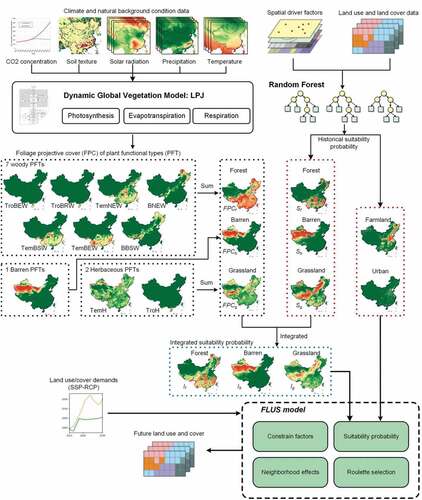
Table 1. PFTs modeled by LPJ and their corresponding LULC types.
Table 2. List of spatial driving factors.
Figure 2. Simulated land use/land cover pattern by LPJ-FLUS, RF-FLUS, and ANN-FLUS for 2010.
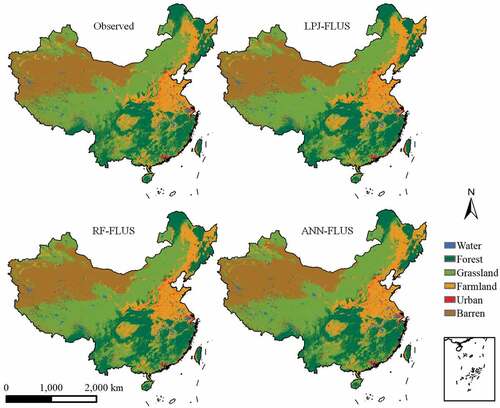
Figure 3. Simulated land use/land cover pattern by LPJ-FLUS, RF-FLUS, and ANN-FLUS for 2015.
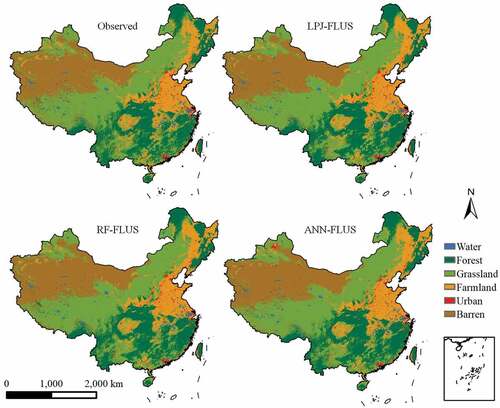
Table 3. Accuracy (FoM) of the simulated results by different models.
Table 4. FoM of each land type.
Figure 4. Comparison of simulated patterns of 2015 generated by LPJ-FLUS, RF-FLUS, and ANN-FLUS in China.
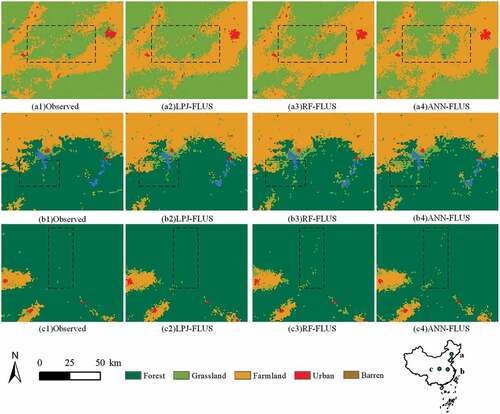
Figure 5. ROC and AUC of the suitability probabilities for each land cover category estimated by the RF model.
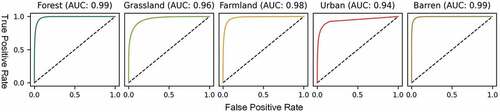
Figure 6. Projections of forest land, grassland, farmland, urban land, and barren land areas for 2015–2100 under the SSP1-RCP2.6 and SSP5-RCP8.5 scenarios.
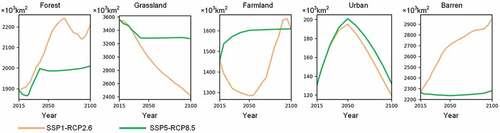
Figure 7. Suitability probability of forest land, grassland, and barren land in 2100 under SSP1-RCP2.6 and SSP5-RCP8.5 generated by the LPJ model, the RF model, and LPJ-FLUS.
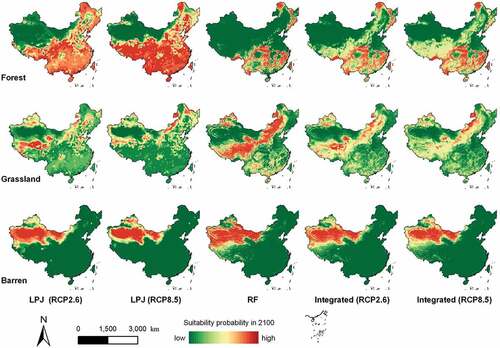
Figure 8. Differences between LPJ-FLUS and RF-FLUS in simulating forest land change from 2015 to 2100 in northeast China under different scenarios. Top row: transition of forest land from 2015 to 2100. Bottom row: suitability probability of forest land for 2100.
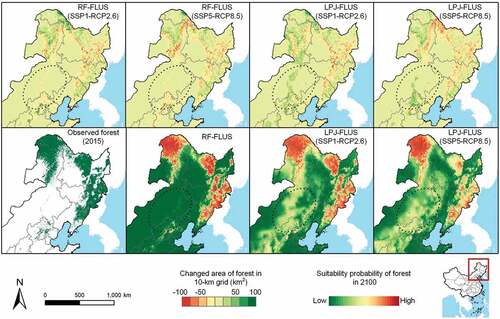
Figure 9. Differences between LPJ-FLUS and RF-FLUS in simulating grassland change from 2015 to 2100 in western China under different scenarios. Top row: transition of the grassland from 2015 to 2100. Bottom row: suitability probability of grassland for 2100.
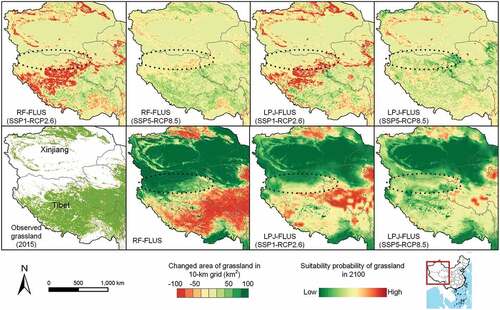
Figure 10. Differences between LPJ-FLUS and RF-FLUS in simulating barren land change from 2015 to 2100 in western China under different scenarios. Top row: transition of the barren from 2015 to 2100. Bottom row: suitability probability of barren for 2100.
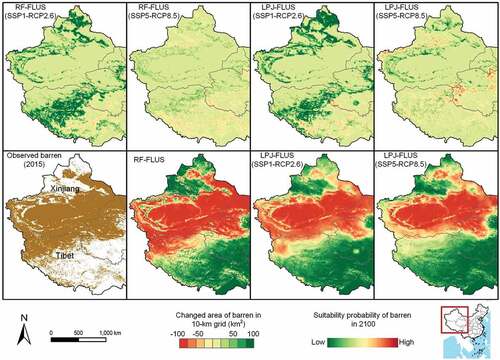
Table 5. Correlation of the suitability probabilities provided by the LPJ model in 2100 with the simulated spatial distribution of natural vegetation from LPJ-FLUS and RF-FLUS.
Data availability statement
The data that support the findings of this study are openly available in figshare at https://figshare.com/s/c31247c33c08b59110f3.