
Figures & data
Figure 1. Location of the study areas. (a) represents the location of the study areas; (b) and (c) denote the true color composite images from 639 nm, 550 nm, and 470 nm of Site a and Site B used in this study; (d) and (e) are the live photo of the study area.
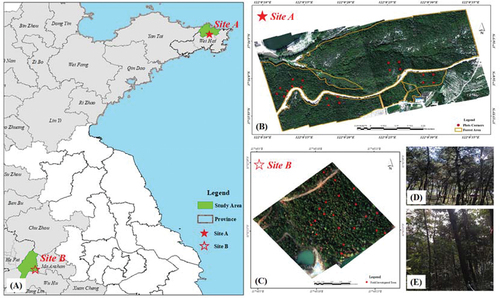
Table 1. The segmentation indices and thresholds of each dataset.
Figure 2. UAV-based remote-sensing data analysis processing framework for a comprehensive assessment of different PWD infection stages.
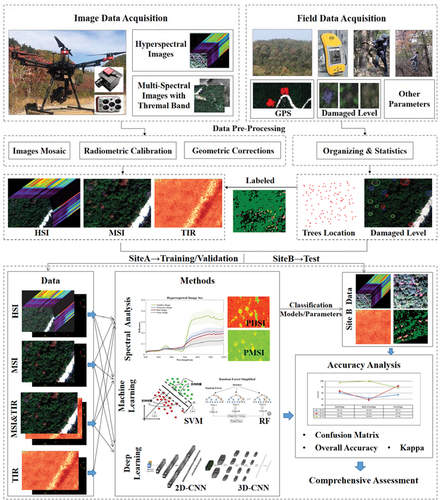
Figure 3. Typical images of different PWD infection stages and corresponding categorized standards of each stage in this study.
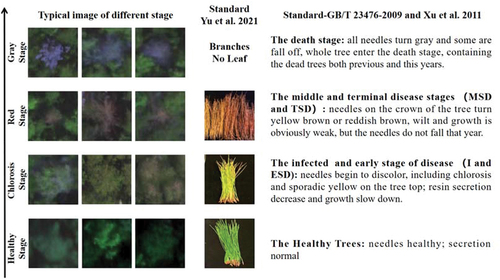
Table 2. The detailed information of training, validation, and test sets for different classification algorithms.
Figure 4. Architecture of the 2D- and 3D-CNN models for HSI dataset. (A) is the architecture of 2D-CNN and (B) is for 3D-CNN.
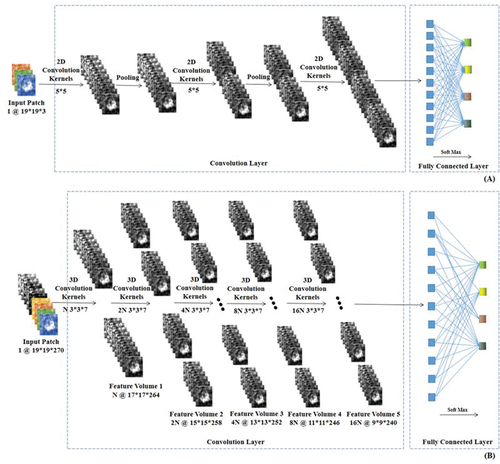
Figure 5. SPA bands selection result. (a) Variation in RMSE as the number of selected bands increase. (b) Final optimal selected bands.
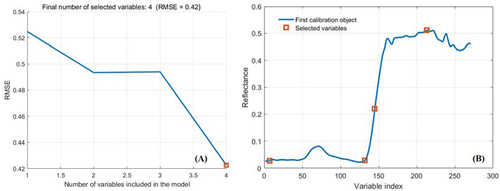
Figure 6. Scatterplot of different simple indices and the classification performance and thresholds of three construction spectral indices. (a) and (b) are the simple indices for the HSI dataset; (c) and (d) are the simple indices for the MSI dataset; (d), (e) and (f) are the classification performance of each spectral indices for HSI, MSI and MSI&Tir dataset. The different color dots are the spectral index values of four corresponding infection stages.
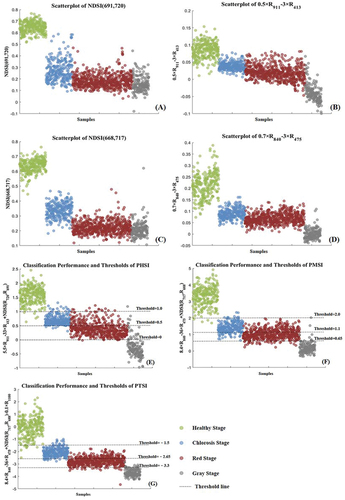
Table 3. The overall accuracy and kappa coefficient of validation set under different classification algorithms for different datasets.
Figure 7. The classification confusion matrices (percent) of different algorithms with different datasets. The horizontal axis is the ground truth and the vertical axis is the classification result.
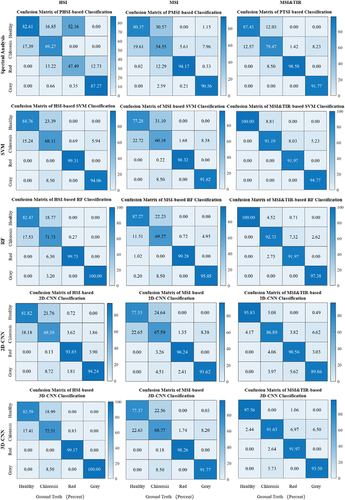
Table 4. The overall accuracy and kappa coefficient of test set under different classification algorithms for different datasets.
Table 5. The two-way ANOVA results.
Figure 8. The classification results of different algorithms using different datasets.
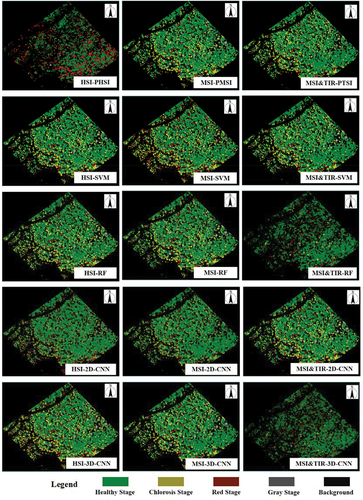
Figure 9. Comparison mapping with investigation results. Circles and crosses indicate the remote sensing classification results and investigation results, respectively.
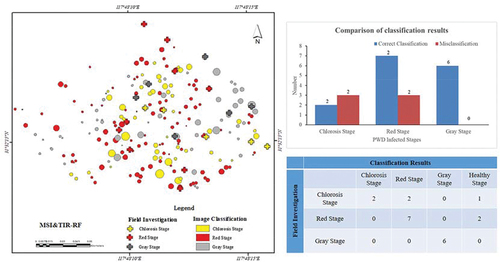
Table 6. Comparisons of classification accuracy among different data sources.
Figure 10. Classification results and infected tree crown delineation maps based on the MSI&Tir dataset.
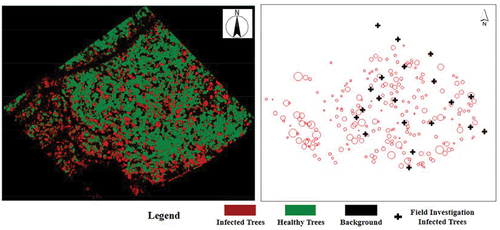
Table 7. Comparisons of classification accuracy among different spatial resolution datasets.
Data availability statement
The data that support the findings of this study are available from the first author, [Ning Zhang, [email protected]], upon reasonable request.