
Figures & data
Figure 1. Map of the study area. (a) amplitude synthetic aperture radar (SAR) image of the sentinel-1 ground range detected (GRD) product collected on November 17, 2016 depicting hawaii’s big island. The red dotted rectangle denotes the area of interest located in the eastern part of the east rift zone (ERZ). (b) the optical image of multispectral Landsat-8 operational land imager (OLI) in February 2019 shows the lava flow area (courtesy of United States geological survey; USGS). The yellow dotted polygons indicate previously erupted lava, and the other darker areas (red arrow) were created by the lava flow during the volcanic eruption in 2018.
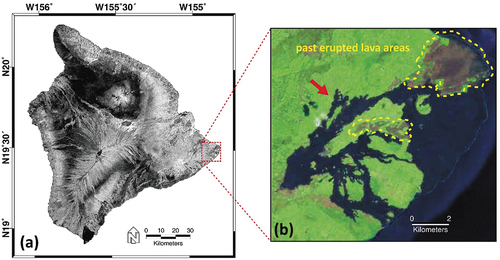
Table 1. The list of data used in this study.
Figure 2. The data processing scheme used for constructing the lava flow map. Flow chart of the (a) coherent change detection (CCD) analysis using Sentinel-1 interferometric wide mode terrain observation with progressive scan (TOPS) SAR single look complex (SLC) observations, (b) land surface temperature (LST) conversion using landsat 8 OLI and thermal infrared sensor (TIRS) measurements, and (c) comparison between the coherence and LST value. For the conversion of brightness temperature (BT), we used top-of-atmosphere (TOA) information of thermal band 10 and the normal difference vegetation index (NDVI), proportion of vegetation (Pv), and surface emissivity (ε) of bands 4 and 5.
Figure 3. A time series of coherence maps showing lava flow from periods before and after the eruption. The data in each inset indicate the interferometric pair used for generating the coherence map. The lava flow area over time is clearly detected by high coherence values. The yellow dotted polygons in (a) indicate the previously erupted lava area. The red dotted polygon in (q) indicates partial coherence degradation despite the termination of volcanic activity. The cyan dotted polygon in (v) shows the entire lava flow area, including the past lava flow area.
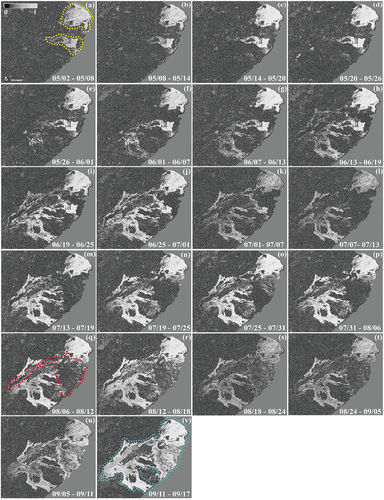
Figure 4. (a) CCD estimation and (b) DEM subtraction results for the lava flow maps. The newly created lava areas from the eruption in 2018 were 33.3 and 34.8 km2 using the CCD estimation approach and DEM subtraction method, respectively. Thresholds to discriminate the lava flow field from other surface features are zero coherence change and zero meters in DEM. The A-A’ transection line was used to evaluate the height differences due to eruptions.
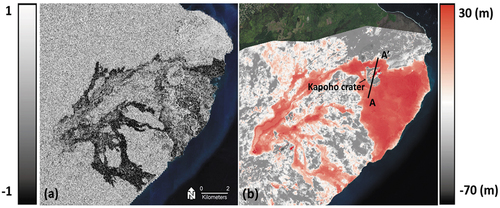
Figure 5. The final lava flow maps from the (a) CCD analysis, (b) subtraction of DEMs, and (c) USGS lava thickness map (Hawaiian-Volcano-Observatory Citation2019). The overall patterns of the constructed lava flow field are similar. The CCD analysis result is in good agreement with the reference lava flow map obtained from the USGS at the inland area, whereas the DEM subtraction result represents a newly formed land area along the coastline (the red dotted polygon area in ).
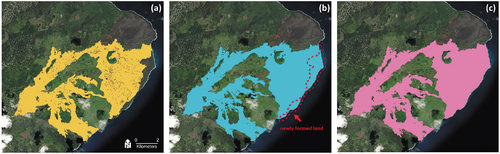
Table 2. The total area of each estimated lava flow field (km2), as shown in , and the percentage of overlap area with respect to the USGS lava thickness map (%).
Figure 6. (a) the profile shows the topographic heights of two LiDAR DEMs before (blue line) and after (red line) eruption along the A-A’ line to indicate the height change resulting from the lava flow. (b) flow direction analysis using slope information of the provided DEMs before (blue arrow) and after (red arrow) eruption. The arrow shows the flow direction and the size of the arrow indicates the flow velocity. The yellow symbol indicates the opening fissure 8 of eruptions in 2018.
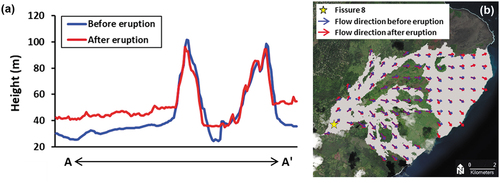
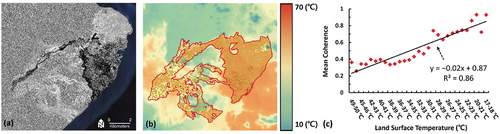
Figure 7. (A) CCD analysis using coherence maps obtained on August 6 and 12, which reflect the surface condition after the volcanic activity, and those obtained on September 11 and 17, which correspond to lava flow characteristics after approximately one month of volcanic activity. The different color schemes from black to white in the lava field indicate that the coherence level may differ with respect to the lava flow status. (b) the estimated LST map using the Landsat-8 dataset acquired on August 4 and 13. The random point sampling (1,500 points) inside the lava flow field boundary (red polygon) was selected to examine the correlation between the coherence level and LST. (c) a scatter plot between the coherence and LST has an interval of 1°C. The linear regression model suggests that both observations are inversely proportional with good agreement (coefficients of determination were>0.85).
Data availability statement
The data that support the findings of this study (i.e. the land cover and probability maps, respectively) are available from the corresponding author, SHH, upon reasonable request.