
Figures & data
Figure 1. (a) A topographic map of the Baikal Rift Zone. Black lines indicate the traces of active faults reported by the Global Earthquake Model (GEM) Global Active Fault, and white rectangles represent the imaging coverages of the Sentinel-1 and ALOS-2 InSAR pairs. (b) Enlarged topographic map around the epicenter of the January 2021 earthquake (red dotted box in (a)). The dark blue color represents Lake Hovsgol, the red stars represent the epicenter of the Mw 6.7 Hovsgol earthquake reported by different seismological agencies (Global Centroid Moment Tensor, GCMT; United States Geological Survey, USGS; Geoscience Australia, GeoAu; German Research Centre for Geosciences, GFZ; and Institut de physique du Globe de Paris, IPGP), and the yellow dots indicate the aftershock epicenters reported by USGS.
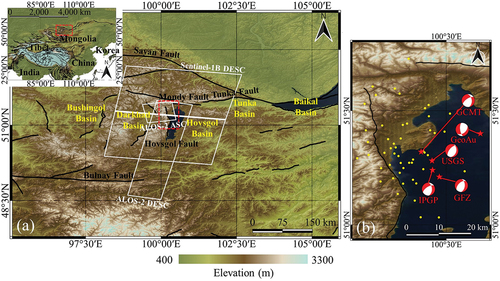
Table 1. Source parameters of the mainshock of the January 2021 Hovsgol earthquake as reported by different organizations and studies.
Table 2. Sentinel-1B and ALOS-2 InSAR pairs used to measure the coseismic surface displacements of the mainshock of the January 2021 earthquake.
Figure 2. Differential interferogram for the mainshock of the January 2021 earthquake generated from the (a) Sentinel-1B descending interferogram, (b) ALOS-2 ascending interferogram, and (c) ALOS-2 descending interferogram. The black lines represent the traces of the active faults reported by GEM.
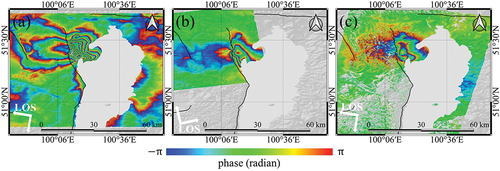
Table 3. Precisions of DInSAR-measured surface displacements in the LOS direction.
Figure 3. Surface displacements in (a) N–S, (b) E–W, and (c) U–D directions calculated from the Sentinel-1B and ALOS-2 DInSAR observations. The black lines represent the traces of the active faults reported by GEM.
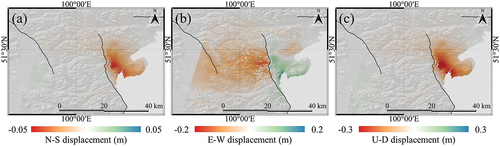
Figure 4. DInSAR image generated using the Sentinel-1 InSAR pair obtained on 25 April 2021 and 7 May 2021, which captured an Mw 5.6 aftershock on 3 May 2021. The black lines represent the active faults reported by GEM and the red star indicates the aftershock epicenter reported by the USGS.
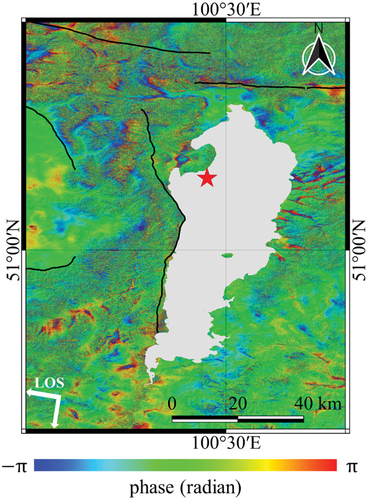
Figure 5. DInSAR-observed and simulated surface displacements, assuming a uniform slip. Line-of-sight (LOS) displacements were measured from the (a) Sentinel-1B descending path, (d) ALOS-2 ascending path, and (g) ALOS-2 descending path. Simulated LOS displacements for the (b) Sentinel-1, (e) ALOS-2 ascending path, and (h) ALOS-2 descending path are also presented, including the residuals between the measured and simulated displacements for the (c) Sentinel-1, (f) ALOS-2 ascending path, and (i) ALOS-2 descending path. Black lines represent the traces of the active faults reported by GEM.
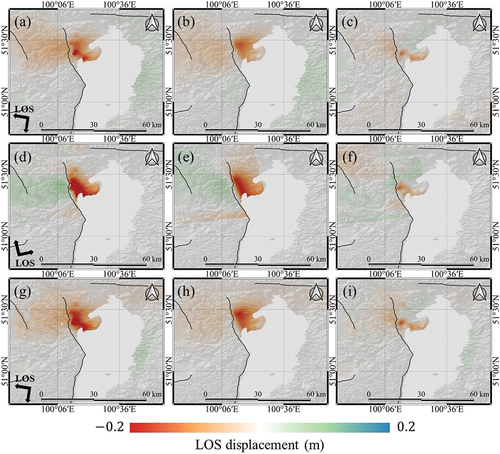
Table 4. Optimal fault geometry and source parameters derived from the inversions performed by assuming a uniform slip.
Table 5. Statistics of the residuals between the DInSAR-measured and modeled surface displacements inverted by assuming the uniform and distributed slips.
Figure 6. A trade-off curve between misfit and model roughness. The optimal smoothing factor that balances model misfit and roughness was determined as 0.02.
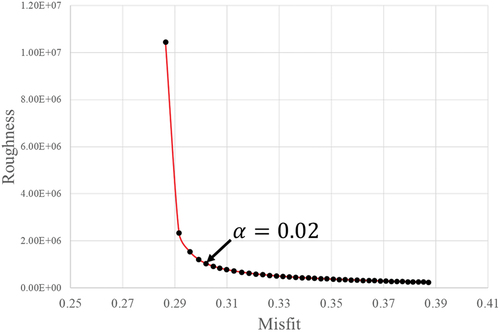
Figure 7. DInSAR-observed and simulated surface displacements, assuming the distributed slip. Line-of-sight (LOS) displacements were measured from the (a) Sentinel-1B descending path, (d) ALOS-2 ascending path, and (g) ALOS-2 descending path. Simulated LOS displacements for the (b) Sentinel-1, (e) ALOS-2 ascending path, and (h) ALOS-2 descending path are also presented, including the residuals between the measured and simulated displacements for the (c) Sentinel-1, (f) ALOS-2 ascending path, and (i) ALOS-2 descending path. Black lines represent the traces of the active faults reported by GEM.
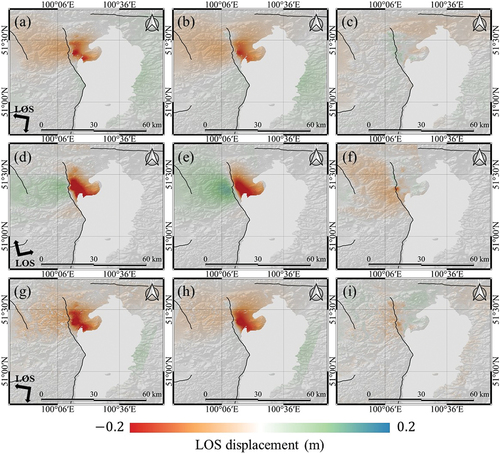
Figure 8. Slip distribution of the fault plane from the preferred model. (a) Total, (b) strike, and (c) dip slips. The red box in (a) indicates the location where the strike of the NHF is dramatically bent. Black lines represent the traces of the active faults reported by GEM.
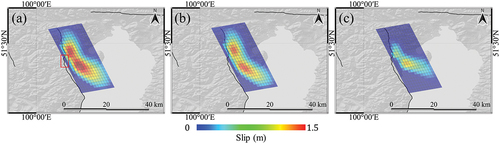
Figure 9. ∆CFS values at depths of (a) 0–10 km, (b) 10–15 km, and (c) 15–20 km caused by the January 2021 earthquake calculated using the optimal source parameters of Model 3 given in . The white dots indicate the aftershock epicenter reported by USGS, and the black lines represent the active fault traces.
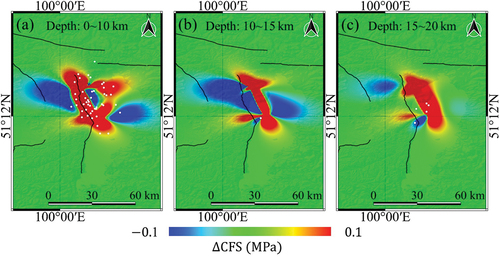
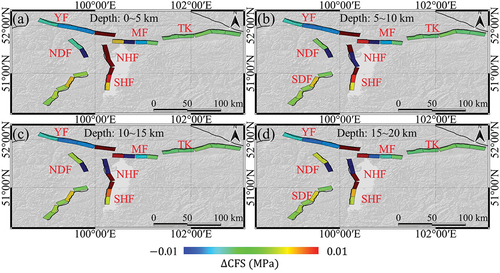
Figure 10. ∆CFS values of the faults around the epicenter of the January 2021 earthquake.
Data availability statement
The data that support the findings of this study are available upon request from the corresponding author (H.H.), upon reasonable request.