
Figures & data
Figure 1. a: Study area location with distance from epicentre. The PGA values are in percentages. b: Investigation area (red outline) with landslides (yellow) used as preliminary training data for the deep learning model. c: MTL manually mapped over the years between 2013 and 2019 in the investigation area.
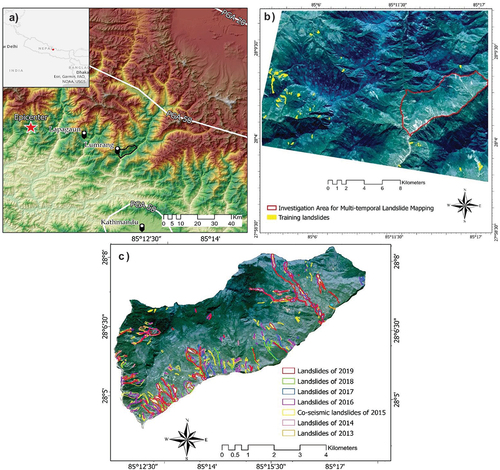
Table 1. Information about the satellite images from RapidEye and the respective landslides.
Figure 2. Conceptual diagram of the methodology. a: data acquisition of satellite images between 2013 and 2017, and manually annotated landslides of the same periods. b: model training and prediction using transfer learning. c: comparison methods with classical metrics and landslide spatial distribution.
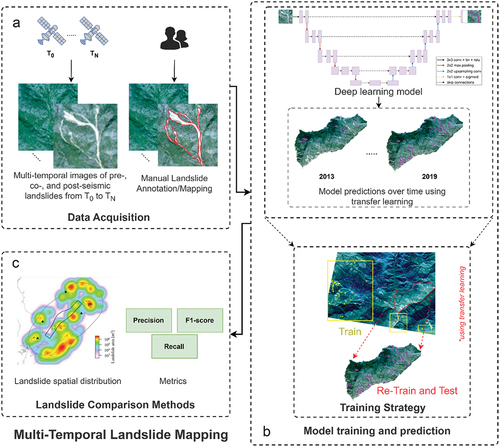
Figure 3. An overview of the U-Net model used in our research based on (Ronneberger, Fischer, and Brox Citation2015).
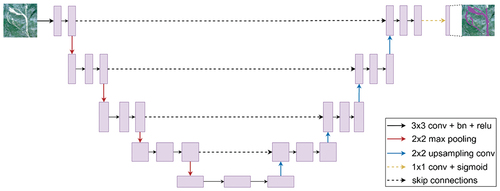
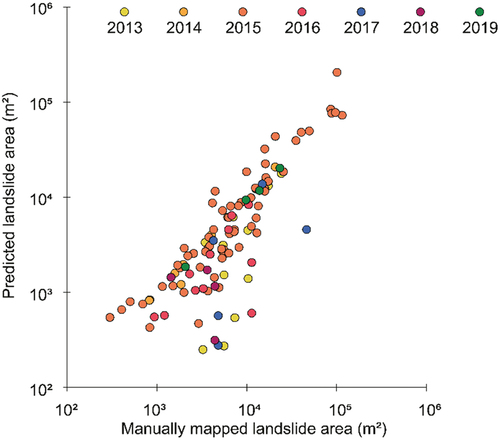
Figure 4. Predicted landslides versus the manually delineated landslides for the years 2013 till 2019.
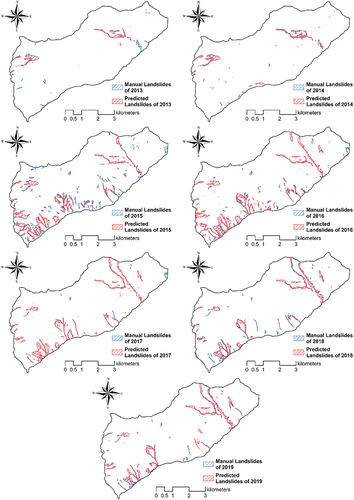
Table 2. Table of various hyper-parameter combinations based on the preliminary training data and test data of 2016 (bold are the best combinations results).
Table 3. Table of results for each year between 2013 and 2019 (using 32 filters, a batch size of 32 and a learning rate of 0.001).
Table 4. Comparison of landslide statistics for the manually mapped landslide inventories versus the predicted ones.
Figure 5. Example of missing landslides in the MI of year 2017. Base image: RapidEye, 2017.
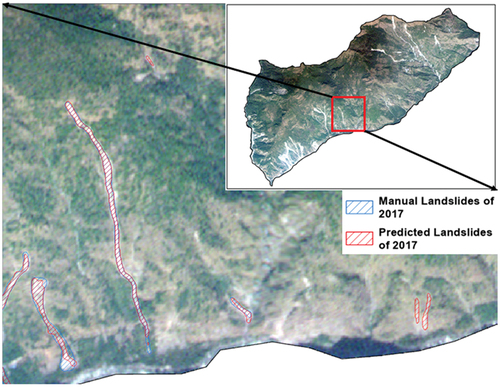
Figure 6. Fragmentation of the landslides of the predicted inventories (red) compared to the manual inventories (blue).
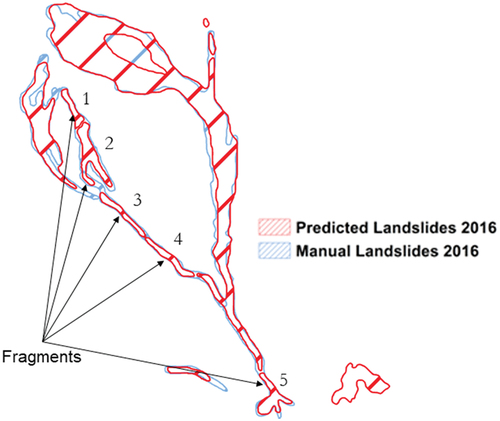
Figure 7. The density of the landslides of the MIs versus the PIs for the year 2013 till 2019. The density values are normalized between 0 and 1 for visual comparison purposes between the MIs and PIs.
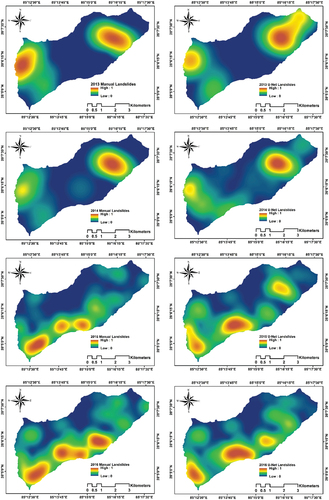
Figure 7. (Continued).
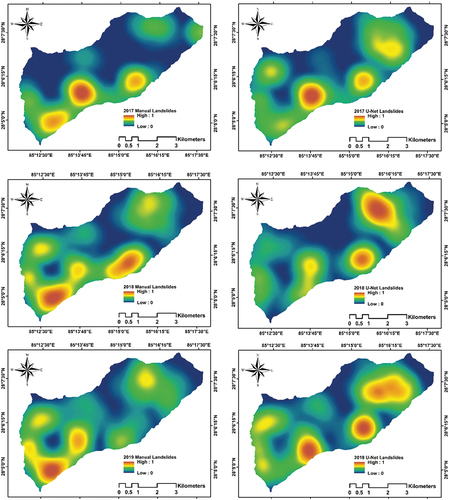
Table 5. Comparison of landslide density for the manually annotated landslide inventories versus the predicted landslide inventories.
Figure 8. Difference in area between the landslides of MIs versus the PIs. The Pearson correlation between the PI and MI in this graph is 0.985.
Data availability statement
We present the data and codes openly available at https://github.com/kushanavbhuyan/Multi-Temporal-Landslide-Mapping-Nepal to encourage reproducibility of the study. We include a Jupyter Notebook script and the trained model weights, making it straightforward for interested academics to design and test MT landslide inventories in new regions of interest.