
Figures & data
Figure 1. Location of the Loess Plateau and the spatial distribution of the reference samples.
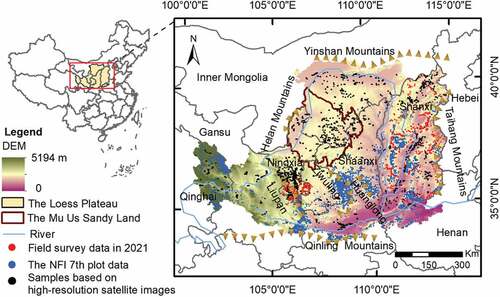
Figure 2. Flowchart of the DCE framework for extracting planting year and conversion patterns of planted forests: (i) data pre-processing, (ii) standard NDVI time-series construction, (iii) planted forest mapping, (iv) planting year and conversion patterns extraction, and (v) accuracy assessment.
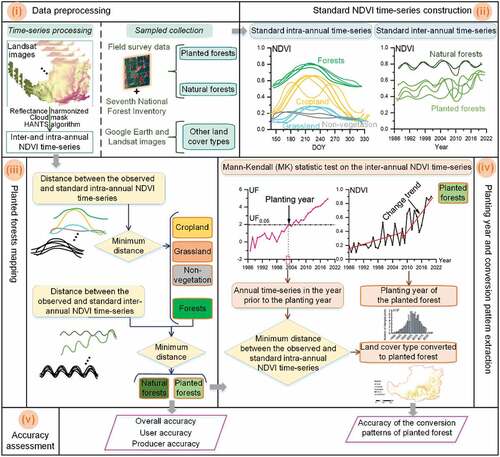
Table 1. Numbers of samples and their sources for each land cover type.
Table 2. Accuracy assessment for the land cover classification in 2021.
Table 3. Accuracy assessments for change detection in the conversion patterns types.
Figure 3. Land cover classification results: (a) area (*106ha) and percentage of each land cover type in the study area, and (b) land cover map in 2021.
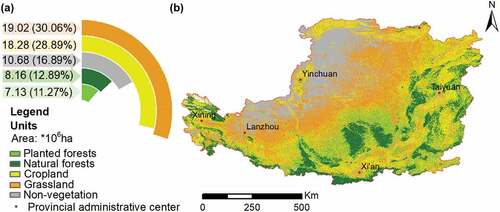
Figure 4. Temporal characteristics of the conversion to planted forests: (a) total area of planted forests and (b) number of newly planted forest pixels in each year forming four temporal phases (TPs), and (c) spatial distribution of the newly planted forests in TP1, TP2, TP3, and TP4, respectively.
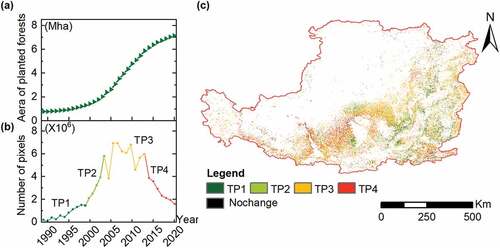
Figure 5. Conversion patterns of planted forests (i.e. from previous land cover type to planted forests, including persistence, afforestation, and deforestation): (a) chord diagram of conversion patterns, (b) spatial distribution of conversion patterns.
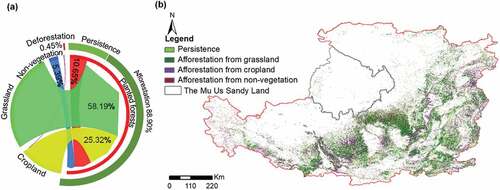
Figure 6. Conversion patterns for planting trees on grasslands (a–d) and returning croplands to forests (e–h), (a) spatial distribution of the grasslands converted to planted forests, (b) newly planted forest pixels from grasslands in each year, (c) inter-annual NDVI time-series and trend in MK statistics (UF) of a conversion process from grasslands to planted forests, (d) intra-annual NDVI time-series and corresponding Google Earth image in 2011 and 2021, and (e) spatial distribution of the croplands converted to planted forests, (f) newly planted forest pixels from croplands in each year, (g) inter-annual NDVI time-series and trend in MK statistics (UF) of a conversion process from croplands to planted forests, and (h) intra-annual NDVI time-series and corresponding Google Earth image in 2011 and 2021.
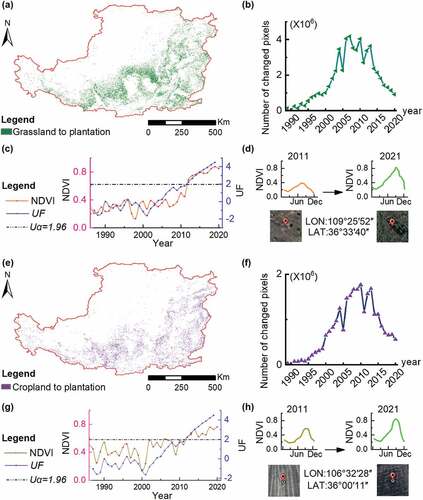
Figure A1. Number of Landsat observations in each year.
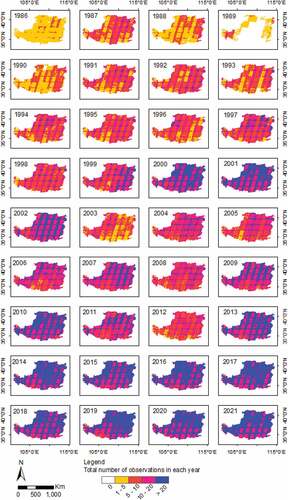
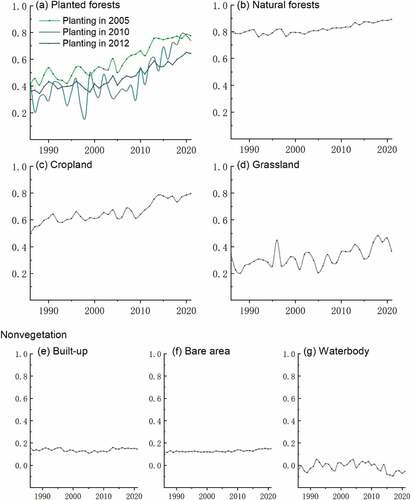
Figure A2. Typical standard inter-annual NDVI time-series for seven land cover types: (a) planted forests, (b) natural forests, (c) cropland, (d) grassland, (e) built-up, (f) bare area, and (g) waterbody.
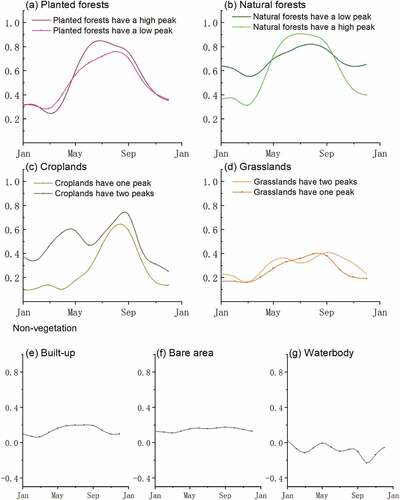
Figure A3. Typical standard intra-annual NDVI time-series for seven land cover types: (a) planted forests, (b) natural forest, (c) cropland, (d) grassland, (e) built-up, (f) bare area, and (g) waterbody.
Data availability statement
The land cover map in 2021 and the core code for clustering standard NDVI time-series and mapping planted forests are available on the Google Earth Engine platform at the following website, respectively (https://code.earthengine.google.com/?asset=users/mengyy225/landcovermapofLoessPlateau; https://code.earthengine.google.com/80f9d3af9b63b2bd2444e33e8ba57bef?asset=users%2Fmengyy225%2FlandcovermapofLoessPlateau; https://code.earthengine.google.com/25331e665bb971836265b92cedac11a6?asset=users%2Fmengyy225%2FlandcovermapofLoessPlateau).