
Figures & data
Figure 1. Location and the Landsat 5 TM composite image in 1987 (bands 4, 3, 2 as RGB) of the study area.
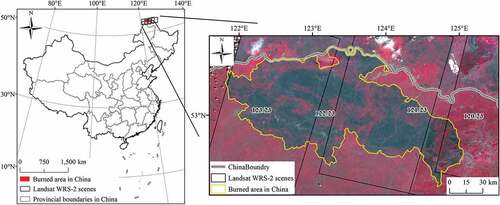
Figure 2. Burn severity of 5.6 Fire in the northernmost part of the Greater Hinggan Mountain area in China.
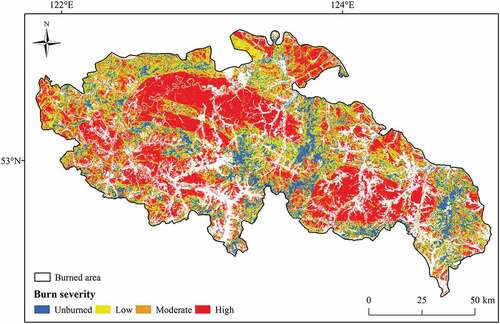
Figure 3. The distribution of mDI values for post-fire logged and non-logged forest samples during 1988–1991.
Figure 4. The rules employed for distinguishing recovery patterns based on the implementation of forest logging and active forest restoration strategies.
Table 1. Categories describing fire, forest logging, and recovery approaches.
Table 2. Accuracy error matrices of forest logging extracted by the methods of mDI threshold and image differencing, according to visually interpreted testing samples in 1988–2011.
Figure 5. Logging map of 5.6 Fire burn area in the northernmost part of the Greater Hinggan Mountain area in 1988–2011. (Three details of post-fire first and secondary logging were indicated by the red frames: A – B shows post-fire logging in 1988 and 1989, respectively, and C shows secondary logging in 1993. The Landsat 5 TM images are shown with bands 3, 2, and 1 as RGB).
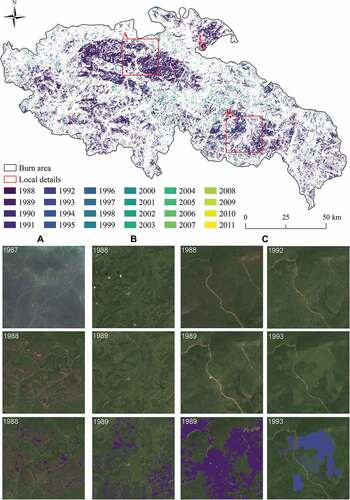
Figure 6. Annual first logged areas, secondary logged areas, and cumulative proportions of the northernmost part of the Greater Hinggan Mountain area in 1988–2011.
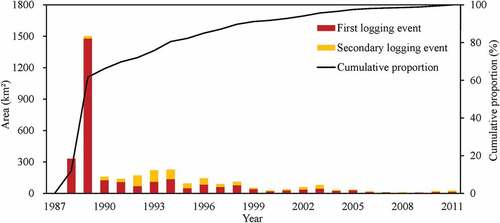
Figure 7. Total logged areas (a), logged proportion of respective burn area (b), and cumulative proportion from 1988 to 2011 (c–d) of the first and secondary forest logging in each burn severity.
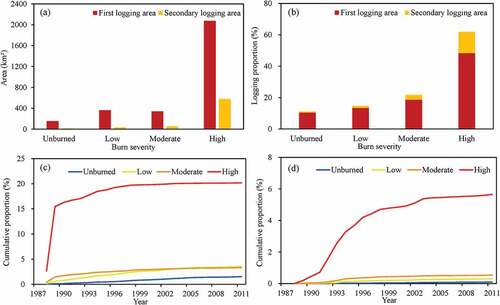
Figure 8. Spatial distribution of the DI map in the burn area, showing on a pre-fire image (1986), fire image (1987), and post-fire images (1989, 1993, 1997, 2001, 2005, and 2011).
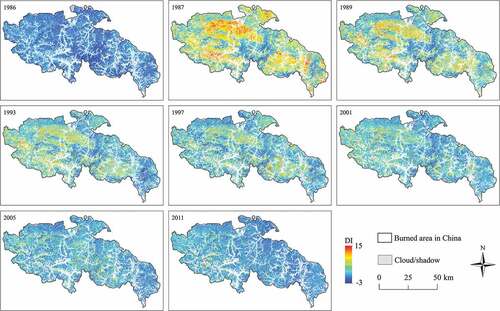
Figure 9. Temporal trajectory of DI value for each recovery patterns in 1988–2011 from the perspective of statistics by years (a) and year after disturbance (b). The acronyms were composed of three parts: the first part indicated burn severity, including unburned (U), low severity (L), moderate severity (M), and high severity (M); the second part indicated forest logging, including logged forest (L) and non-logged forest (NL); the third part indicated recovery approaches, including natural regeneration (NL), artificial regeneration (AR), and assisted natural regeneration (AP).
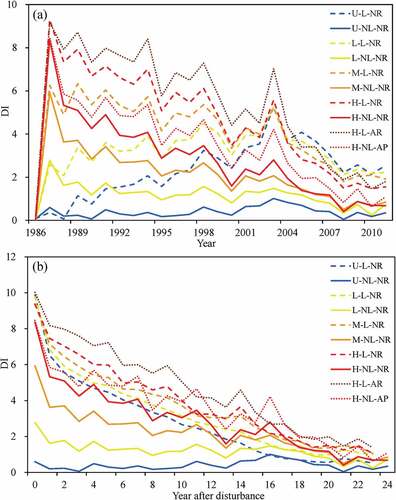
Figure 10. Spatial distribution of recovered forests obtained by DI < 3 in burn area, showing on pre-fire image (1986), fire image (1987), and post-fire images (1989, 1993, 1997, 2001, 2005, and 2011).
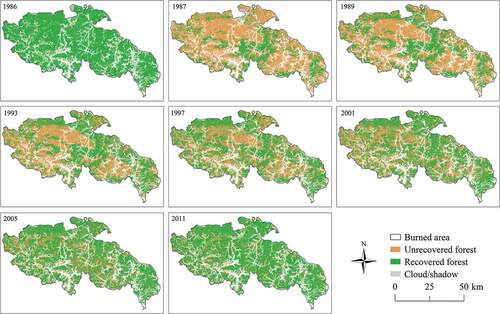
Figure 11. Cumulative proportion of each recovery pattern that has reached forest recovery in 1988–2011. The acronyms were composed of three parts: the first part indicated burn severity, including unburned (U), low severity (L), moderate severity (M), and high severity (M); the second part indicated forest logging, including logged forest (L) and non-logged forest (NL); the third part indicated recovery approaches, including natural regeneration (NL), artificial regeneration (AR), and assisted natural regeneration (AP).
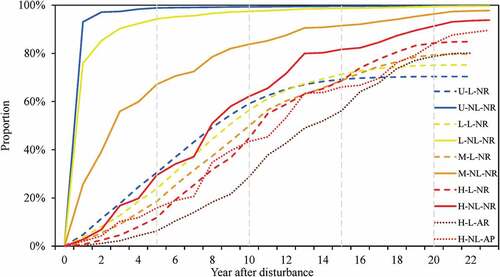
Table 3. The proportion of forest recovery in each recovery pattern at a five-year interval.
Figure 12. The proportion of dominant species in each recovery pattern by forest inventory data in 2018.
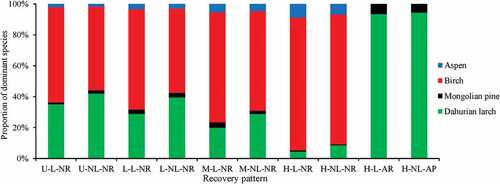
Table 4. The proportion of relative forest recovery in each recovery pattern at a five-year interval.
Supplemental Material
Download Zip (36.9 MB)Data availability statement
Google Earth Engine (https://code.earthengine.google.com/) is a free and open platform. All data, models, and code generated and/or used during this study are available from the corresponding author upon request.