
Figures & data
Table 1. Technical specifications for the GF-1 sensor.
Figure 1. Some ship examples in different bands of the GF-1 imagery.
Figure 2. Flow chart of cascaded detection of ship hull and wake in this study.
Figure 3. The process of hull refining module.
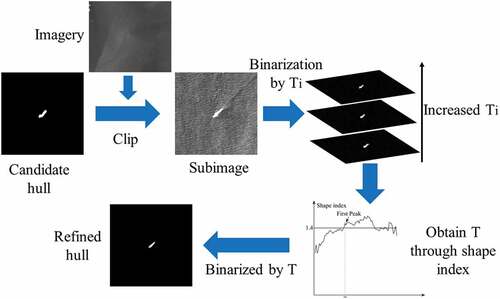
Table 2. Minimum and maximum of hull shape features for real ships.
Figure 4. Simulated images with the presence of striped wakes (a) and natural waves (c). The corresponding images after Fourier transform are shown in (b) and (d).
Figure 5. Flow chart for striped wake detection.
Table 3. Hull and wake features for different kinds of ships.
Table 4. Probability that a ship was classified as one of the categories based on hull and wake features.
Figure 6. The saliency detection and hull refining results of ship hulls.
Figure 7. Ship detection and classification results for different scenario. The green polygons were boundaries of ship hulls. Blue and white lines demonstrate dark and bright linear wakes, respectively.
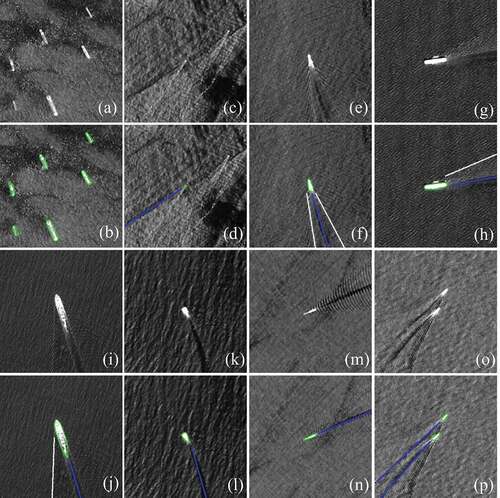
Table 5. Comparison between the performance for the method proposed in this study and state-of-the-art methods.
Figure 8. Statistics of the length, length-width ratio and area of targets identified as true ships.
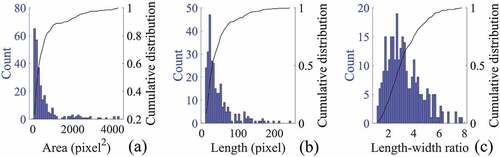
Table 6. Classification results of ships with detected wakes.
Table 7. Summarization of invariant texture feature and classifiers.
Table 8. The optimal texture feature combinations for different classifiers.
Figure 9. The minimum IoU of all samples with the change of TSI.
Data availability statement
The data that support the findings of this study are from Guangdong Data and Application Center for High-resolution Earth Observation System at http://gdgf.gd.gov.cn/GDGF_Portal/index.jsp.