
Figures & data
Table 1. Comparative overview of studies aimed at evaluating seismic vulnerability using remote sensing data. The studies are divided according to the type of data they use: optical imagery, 3D data and other information.
Figure 1. Map of the city of Port Prince divided into urban patterns. The different patterns are color-coded. Examples are shown to the left. The small numbered squares are the sample areas randomly chosen to conduct the present research.
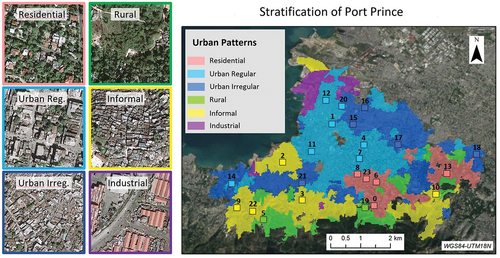
Table 2. Description of the data used in this study.
Figure 2. Pictures of the different Model Building Types (MBT) identified in Port Prince.
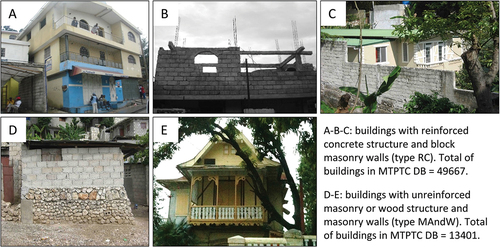
Figure 3. Methodological framework followed in this study. Input data and ground truth data are in the blue boxes.
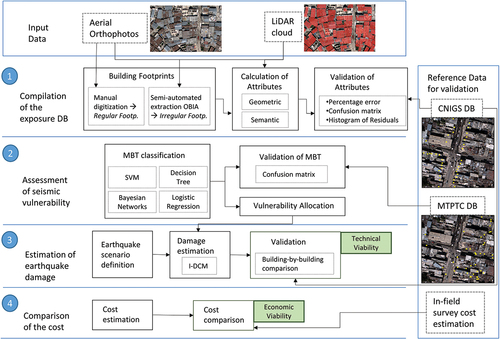
Table 3. List of building attributes calculated to create the exposure database (adapted from GED4ALL taxonomy). Name, definition, calculation method and possible values are provided.
Figure 4. Examples of roofs extracted with OBIA. (A) Gable roofs. (B) Two types of roof materials: Concrete roofs, in blue; metal (tin) roofs, in red.
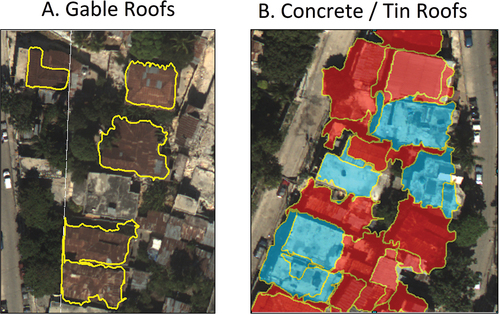
Figure 5. Attributes stored in the exposure database of the buildings present in one residential sample for both, regular (A) and irregular (B) footprints. The windows show the attributes of the buildings in deep red, as an example.
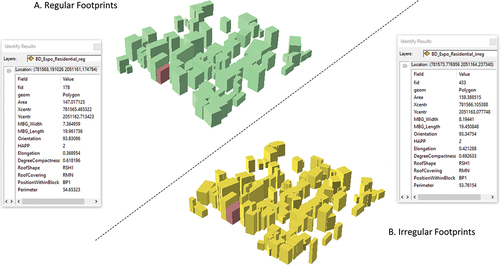
Figure 6. Illustration of the gap between buildings as the main source of discrepancy in the built-up area estimation. Examples are provided for a regular (A) and an irregular (B) footprint.
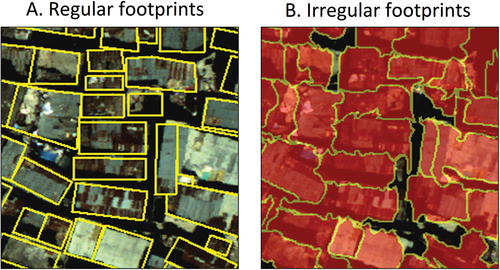
Table 4. Confusion matrix of the image classification process with OBIA. Accuracy measures are given for the five classes identified. Concrete roof and metal roof are of particular interest for the present study.
Figure 7. Comparison of roof material obtained by photo interpretation (A) and OBIA (B). Concrete roofs are in blue; metal roofs are in red. Yellow circles mark examples of classification errors.
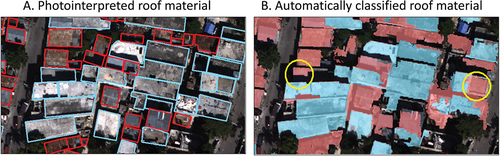
Table 5. Number of samples in the training and testing datasets for MBT classification.
Table 6. Parameters and performance of the predictive models created to classify buildings into MBT. OA stands for Overall Accuracy; Param. stands for parameters tuned for each classifier; SVM (PUK) stands for support vector machine with Pearson VII Universal Kernel; SVM (RBF) stands for support vector machine with radial basis function kernel.
Table 7. Predictive models created for each stratum. Models are ranked by performance. Overall Acc. stands for Overall Accuracy; kappa is the Cohen’s kappa coefficient of agreement; SVM (PUK) stands for Support Vector Machine with Pearson VII Universal Kernel; SVM (RBF) stands for support vector machine with radial basis function kernel; logistic reg. stands for logistic regression.
Table 8. Confusion matrices of the best predictive model for MBT classification: support vector machine with Pearson VII universal kernel. matrices are given per stratum.
Figure 8. Results of building classification in MBT. Left column: Examples of regular footprints in each urban pattern. Right column: Corresponding examples for irregular footprints.
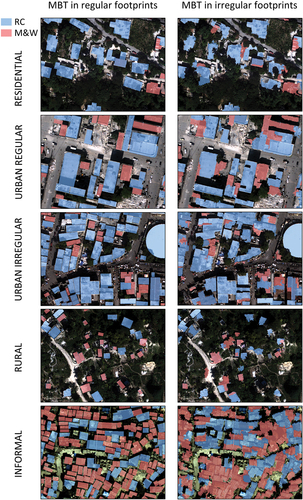
Figure 9. Distribution of vulnerability in the different urban patterns (also named strata). Labels over the columns indicate the number of buildings assigned to each vulnerability model per stratum (color-coded).
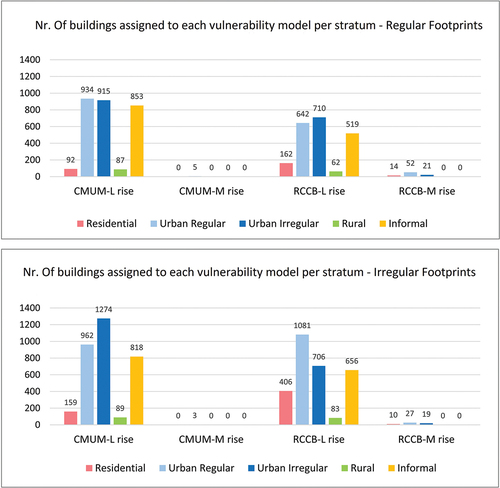
Figure 10. Sample areas in which the validation of the damage assessment was conducted. Red points are the buildings whose damage estimation has been validated. The frames of the samples are color-coded according to the urban pattern also used in .
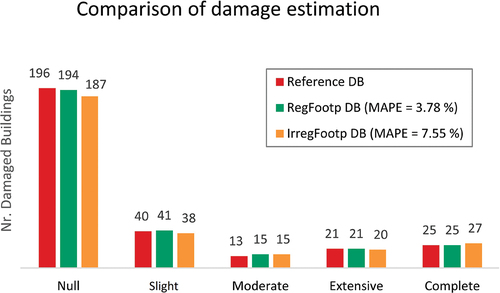
Figure 11. Damage distribution. Labels over the columns indicate the number of buildings reaching each damage grade. The results obtained with each vulnerability database are color-coded.
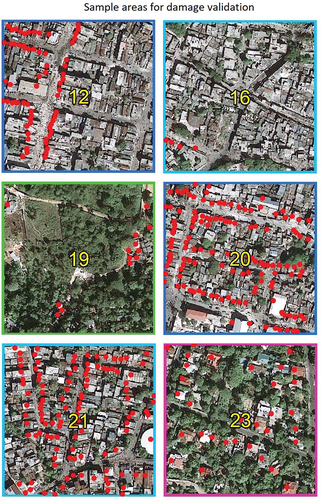
Table 9. List of tasks and time estimation to create an exposure and vulnerability database for 1000 buildings using remote sensing and machine learning techniques.
Table 10. List of tasks to create an exposure and vulnerability database for 1000 buildings by means of an in-field survey.
Table 11. Logistics of an in-field survey for building inspection in a developed country. Summary of the information provided by experts (in rows). The work is divided in three main blocks: preliminary work, in-field survey and data post-processing. For each one, an estimation of human and material resources, time and cost is provided. Time unit is working day (8 hrs.); Cost unit is euro; GPS refers to handheld GPS; Transport refers to rented car; Avg. Cost stands for Average Cost of the amounts right above.
Table 12. Logistics of an in-field survey for building inspection in a developing country. Summary of the information provided by experts (in rows). The work is divided in three main blocks: preliminary work, in-field survey and data post-processing. For each one, an estimation of human and material resources, time and cost is provided. Time unit is working day (8 hrs.); Cost unit is euro; GPS refers to handheld GPS; Transport refers to rented car; Avg. Cost stands for average cost of the amounts right above.
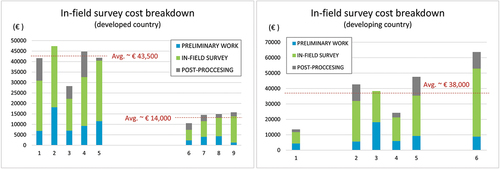
Figure 12. Cost break-down of an in-field survey for building inspection in both, developed (left) and developing (right) countries. Each column represent the amount reported by each expert. The three colors indicate the partial cost that corresponds to each phase of the in-field survey (see legend). Columns are grouped to show clusters and extreme values.
Data availability statement
Part of the data (LiDAR point clouds) that support the findings of this study are available in the public domain at https://www.opentopography.org/. The rest of the datasets (ortho-imagery and building databases) have been provided for this study by third parties and authors have no authorization to share them. References to data providers are given in the text, in the section Materials And Methods. The template of the form that experts filled-in to evaluate the cost of an in-field survey is shared in Mendeley Data with the name “Template – Building In-Field Survey”.