
Figures & data
Figure 1. Location of the study area: (a) location of Maoershan in Heilongjiang Province, P.R. China (China Map Examination No. is GS (2019) 1823); (b) Sentinel-2 image (R: Band3; G: Band2; B: Band1) of Maoershan, and the locations of sample plots; (c) distribution of sample plots; and (d) LiDAR point cloud (i.e. TLS and ULS) of one plot. The projection coordinate system for (b) and (c) is WGS 1984 UTM Zone 52N.
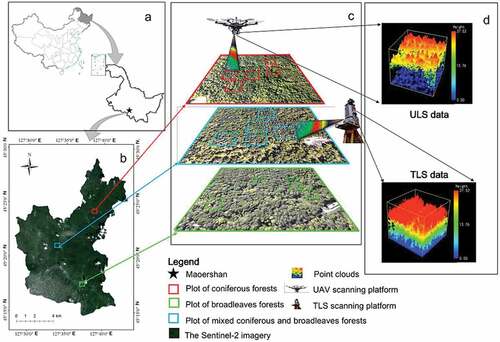
Table 1. Essential parameters of the UAV and terrestrial LiDAR data.
Figure 2. Stand conditions for (a) coniferous; (b) mixed broadleaf-coniferous; and (c) broadleaf forests.
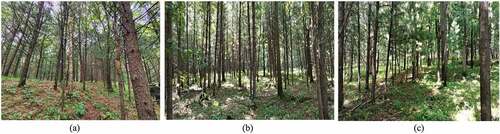
Table 2. Description statistics for individual tree parameters of all the 15 plots.
Figure 3. Flowchart of automated registration based on TLS and ULS and performance assessment using the optimized coarse-to-fine algorithm for coniferous, mixed broadleaf-coniferous, and broadleaf forests.
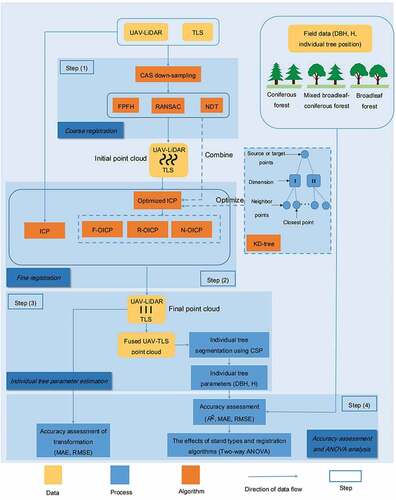
Figure 4. Procedures of the optimized ICP algorithm. The KD-tree was utilized to calculate the nearest point and final point location; the inner loop determined the corresponding point, while the outer loop determined the final point cloud location.
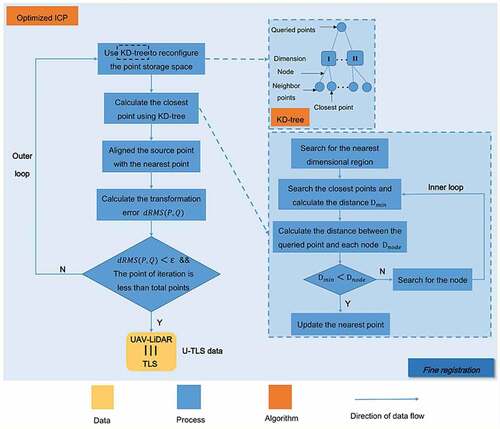
Figure 5. Visual evaluation of the optimized coarse-to-fine algorithms (i.e. F-OICP, R-OICP, N-OICP) for (a) coniferous, (b) mixed broadleaf-coniferous, and (c) broadleaf forests, taking C-5, M-1, and B-2 plot as examples. The white points represent the registered ULS data and the color-rendered points represent the TLS data. Slices I, II, and III represent the sections 1.3 m (DBH) above the ground, tree trunk, and tree crowns, respectively.
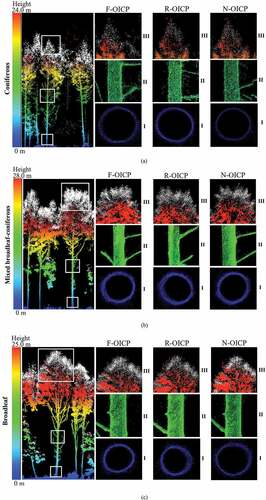
Table 3. Accuracy assessment of transformation in horizontal and vertical directions.
Table 4. Accuracy assessment of ITCD using CSP algorithm based on U-TLS data registered by different algorithms.
Table 5. The accuracy of estimating individual tree DBH using three optimized algorithms and a traditional ICP algorithm.
Table 6. Accuracy of estimating tree height using three optimized algorithms and traditional ICP algorithm.
Table 7. Two-way ANOVA of the accuracy indices of ITCD and individual tree parameter estimation.
Figure 6. Turkey test for the RMSE of DBH and tree height estimated by different registration algorithms for three stand types. (a) F-score of ITCD; main effect: stand type; (b) F-score of ITCD; main effect: registration algorithm; (c) RMSE of DBH; main effect: stand type; (d) RMSE of DBH; main effect: registration algorithm; (e) RMSE of tree height; main effect: stand type; and (f) RMSE of tree height; main effect: registration algorithm. Different lowercase letters indicate statistical differences using Tukey test post-hoc and significant differences between forest stand type or algorithm. “·” represent the outliers.
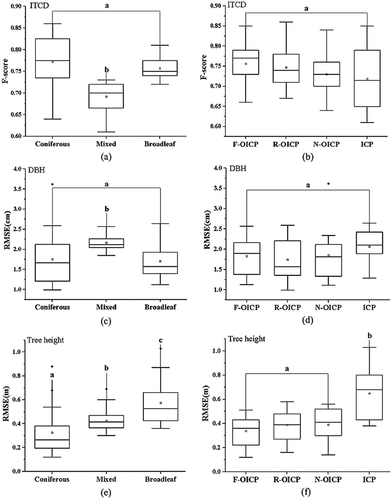
Table 8. Runtime performance of the registration algorithms.
Table A1. All the abbreviations used in this study.
Supplemental Material
Download MS Word (100.3 KB)Data availability statement
The data that support the findings of this study are openly available in [figshare] at [https://doi.org/10.6084/m9.figshare.21786140.v1]. The reference data are available on request from the corresponding authors (Z.Z. and Y.Z.).