
Figures & data
Figure 1. The study area: (a) locations of unmanned aerial vehicle (UAV) sampling areas and mangrove reserves; (b) the number of optical images from Landsat 5/7/8, Sentinel-2, and UAV sensors from 1986 to 2021, and the frequency of observations with good quality pixels.
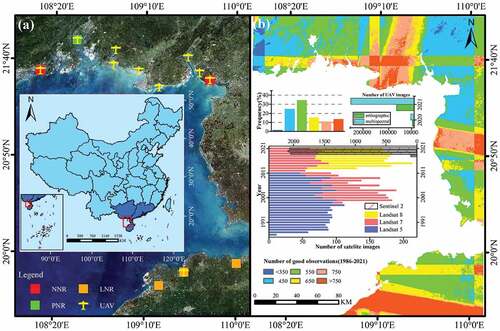
Table 1. Summary of time-series remote sensing images from different platforms.
Figure 2. The workflow of this study.
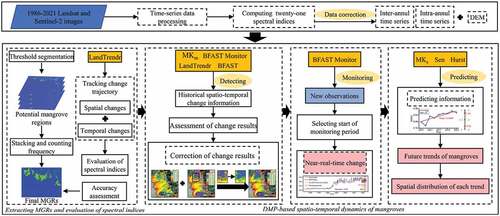
Figure 3. The DMP framework for detecting the dynamics of mangroves: LT, LandTrendr; BF, BFAST; BFM, BFAST Monitor.
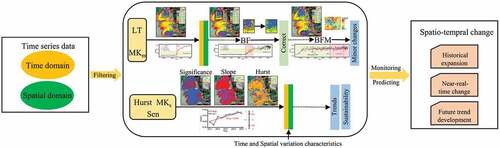
Figure 4. Distribution of sample points in four typical regions of the study areas: (a) Zhenzhu Bay; (b) Beihai Bay; and (c) Tieshan Port; (d) Maowei Sea.
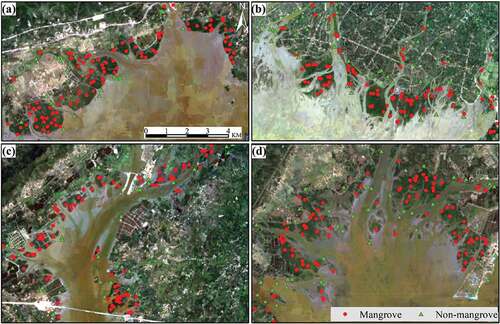
Figure 5. The potential mangrove area obtained by the threshold segmentation method in comparison with Jia et al. and Yang et al. classifications from 1990 to 2020. (a) Changes in mangrove area in ten typical regions: I-i, mangrove area in the i-th year based on classification products; II-i, potential mangrove area in the i-th year based on the method; A, Zhenzhu Bay; B, Fangcheng Bay; C, Maowei Sea; D, Dafeng River; E, Beihai Bay; F, Tieshan Port; G, Dandou Sea; H, Yingluo Bay; I, Anpu Port; J, Danzhou. (b) Changes in mangrove area in Beibu Gulf.
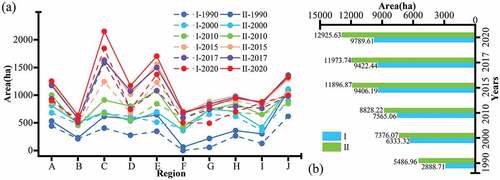
Table 2. The Overall accuracy and kappa coefficient of extracting MGRs in ten typical regions of Beibu Gulf from 1986 to 2021.
Figure 6. The change detection results of twenty-one spectral indices based on the LandTrendr algorithm in the major mangrove area of Golden Bay Mangrove Reserves of Beihai Bay.
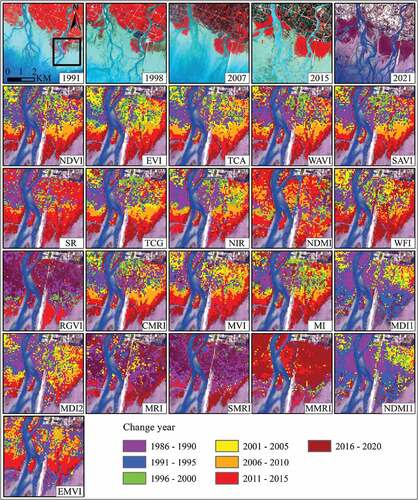
Figure 7. The detection change results of mangroves using ten spectral indices. (a) Frequency of expansion years. The reference is the frequency of expansion years based on visual interpretation. (b) Deviation distribution of the expansion years detected by the six spectral indices (normalized difference vegetation index, enhanced vegetation index, tasseled cap angle, soil-adjusted vegetation index, combined mangrove recognition index, and mangrove vegetation index) and visual interpretation.
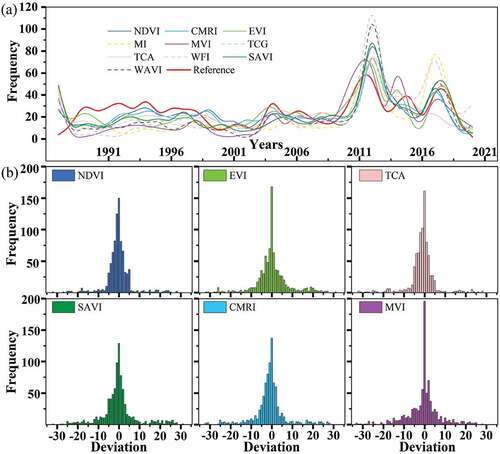
Figure 8. The frequency percentage of expansion events each year was calculated based on the LandTrendr algorithm and MKm with NDVI and TCA time series datasets: (a) Beihai Sea, (b) Maowei Sea, (c) Zhenzhu Bay, and (d) Tieshan Port.
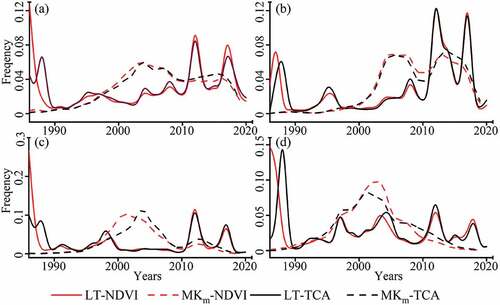
Figure 9. The inter-annual gain area from 1988–2020 (a); annual expansion (AE) (b); and the expansion index (UERi) (c) for all typical regions from 1988 to 2020.
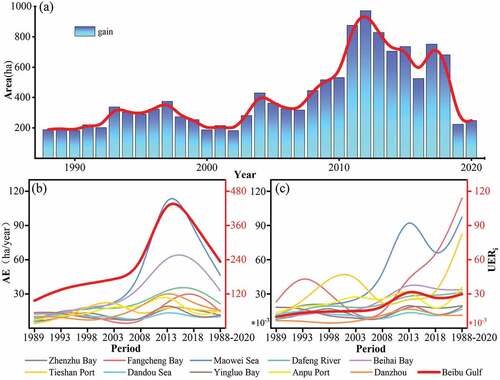
Table 3. Annual expansion (AE) of mangroves for ten typical regions during 1988–2020 (ha/year).
Table 4. Evaluating the intensity of change in mangroves for all typical regions from 1988 to 2020 using the expansion index (UERi).
Figure 10. Spatio-temporal characteristics of mangrove forests in Beibu Gulf: (a) Beibu Gulf; (b) Zhenzhu Bay; (c) Maowei Sea; (d) Tieshan Port; and (e) Beihai Sea.
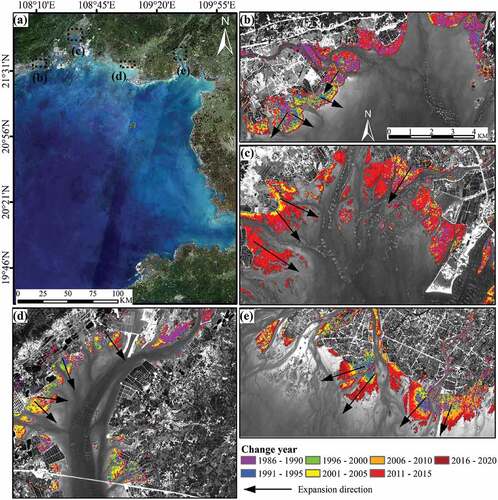
Figure 11. Historical change process of mangroves detected based on MKm, LandTrendr, BFAST, and BFAST Monitor algorithms: (a) the expansion years of mangroves gained by the LandTrendr algorithm in Anpu Port; (b) information for the year corresponding to the intersections of UFk and UBk; (A1) region with deviated expansion years obtained by LandTrendr algorithm; (A2) region after correction of the expansion year by BFAST algorithm. PI, point of intersection; LT, LandTrendr; BF, BFAST; BFM, BFAST Monitor; BFM, BFAST Monitor; AF, algorithm fitting; SI, significant improvement; CL, confidence level; PI, point of intersection.
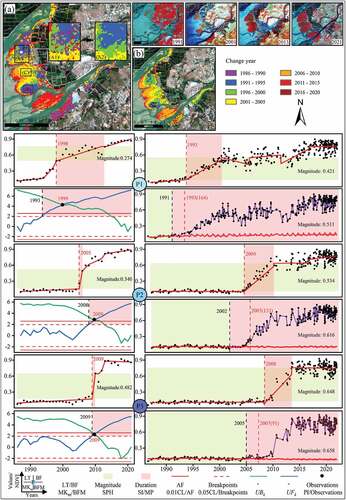
Figure 12. Monitoring results of the structural changes in the mangroves in regions B and C () where the expansion years were earlier and there were longer SPH.
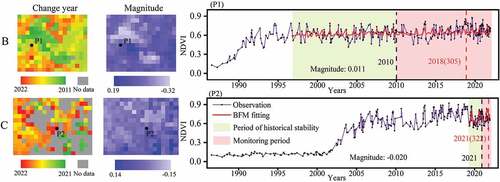
Figure 13. Predicted results using MKs, Sen, Hurst, and 2013–2021 time series data in each typical region: (a) Beibu Gulf; (b) Zhenzhu Bay; (c) Fangcheng Bay; (d) Yingluo Bay; (e) Anpu Port; (f) Tieshan Port; (g) Dandou Sea; (h) Danzhou Port; (i) Maowei Sea; (j) Dafeng River; and (k) Beihai Bay.
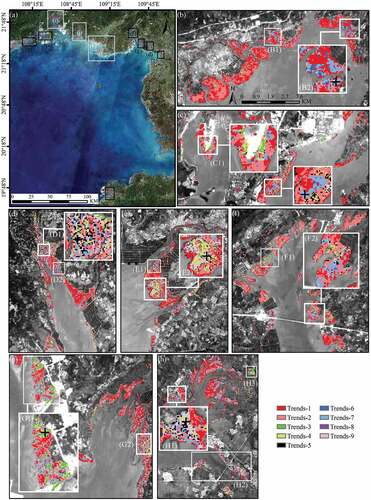
Table 5. Classification of spatio-temporal trends in mangrove areas.
Table 6. Summary of area percentages of each trend type in ten typical regions, and Beibu Gulf overall.
Figure 14. The slope, significance, and sustainability of time series in regions B2, C2, D1, E2, G1, and H1 () from 2013 to 2021. Y1, sustainability; Y2, significance.
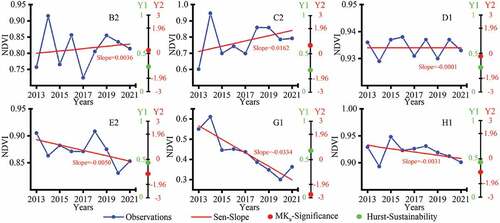
Figure 15. Time series of the NDVI, EVI, and NDMI reconstructed based on maximum/mean/median spectral index composition methods and their results using the LandTrendr algorithm. P1, P2, and P3 are located in mangroves that expanded during different periods, and P4 is located in mudflats. A/B/C, maximum/mean/median spectral index composition method.
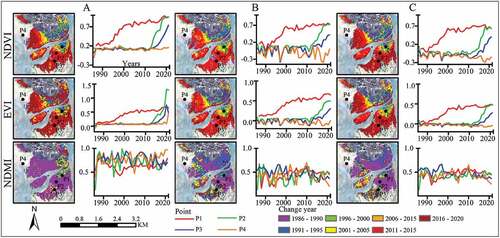
Figure 16. Predictions of future trends in mangroves at D1 and G1 () from 1986 to 2021, 2000 to 2021, and 2013 to 2021. Y1, sustainability; Y2, significance.
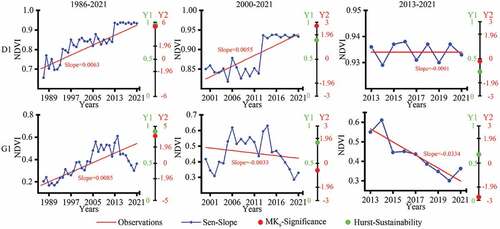
Table A1. Calculation formula for the spectral index in the study.
Table A2. Summary of the DMP framework and its monitoring change information.
Table A3. Parameter values for the LandTrendr algorithm applied in this study.
Table A4. The Overall accuracy extracting the potential mangrove of ten typical regions of Beibu Gulf in 1991,1996,2001,2006,2011,2016 and 2021.
Data availability statement
The mangrove products that support the findings of this study are openly available from National Earth System Science Data Center (http://www.geodata.cn) and Science Data Bank (https://www.scidb.cn).