
Figures & data
Figure 1. Paddy rice distribution in South Korea.
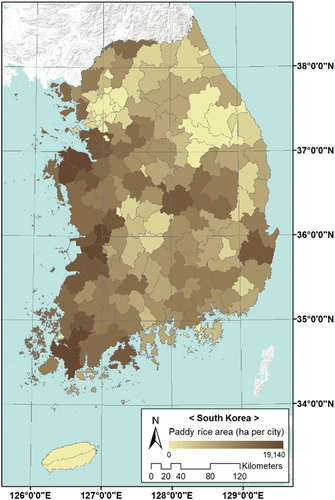
Figure 2. Agricultural land cover labeling in the farm map.
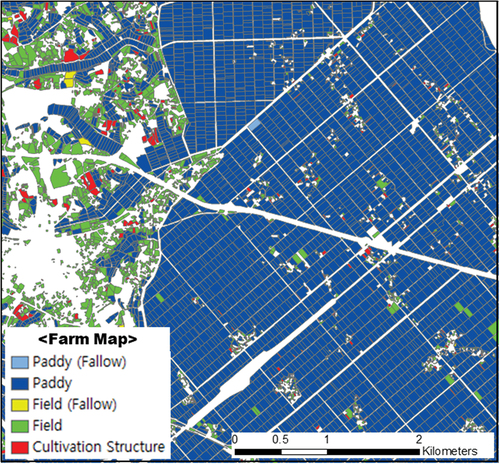
Figure 3. Time-series sentinel-1 images composited based on rice phenology.
Figure 4. Research flow for developing paddy rice detection model.
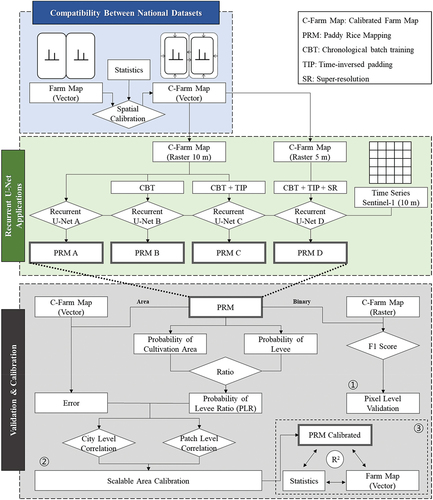
Figure 5. Farm map calibration by introducing levee area.
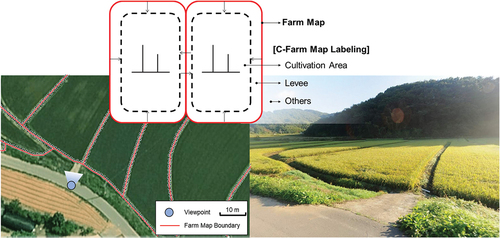
Figure 6. Architecture of proposed recurrent U-Net.
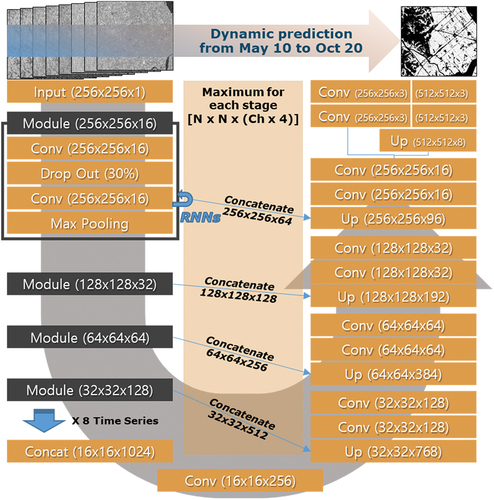
Figure 7. Concept of chronological batch training.
Table 1. Results of farm map calibration according to levee width.
Figure 8. Pixel level-validation through prediction time.
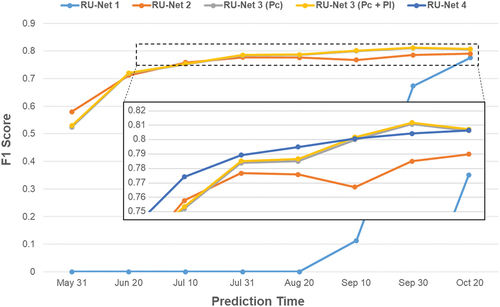
Table 2. Boundary intersection-over-union (BIOU) measured for recurrent U-Net (RU-Net) applications.
Figure 9. Correlation between PLR and error/cultivation area ratio:(a) RU-Net C at city level, (b) RU-Net C at patch level for time steps after June, (c) RU-Net D at city level and (d) patch level on October 20.
Figure 10. Correlation between national datasets and predictions: (a) Farm map to statistics, (b) Farm map to RU-Net C at city level, (c) Statistics to RU-Net C at city level, (d) Farm map to RU-Net D at city level, (e) Statistics to RU-Net D at city level, (f) Farm map to calibrated RU-Net C at city level, (g) Statistics to calibrated RU-Net C at city level, (h) Farm map to RU-Net C at patch level, and (i) Statistics to calibrated RU-Net C at patch level where paddy rice exists.
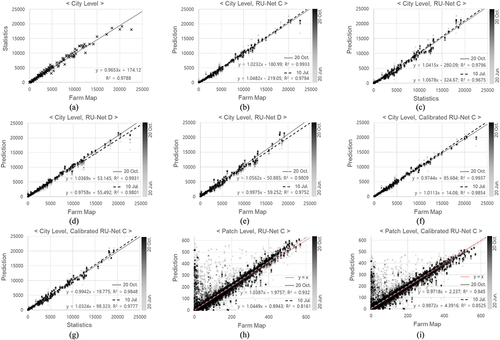
Figure 11. Comparison of spatial details in predictions of RU-Nets C and D.
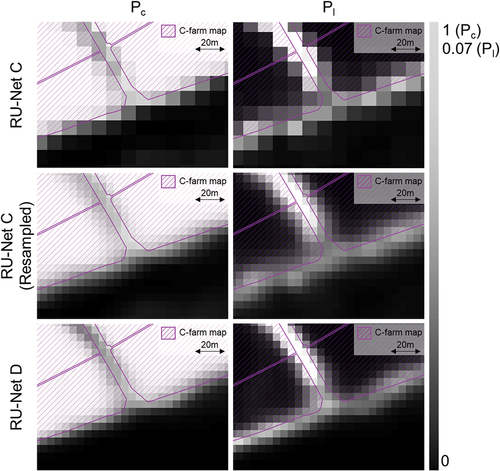
Table 3. Monthly rice prices according to harvest cycle
Table 4. Paddy rice area and expected rice yield based on different datasets.
Figure 12. Time-series pattern of rice price and inversed relative yield.
Table A1. Confusion matrix for paddy rice mapping.
Data availability statement
Paddy rice prediction maps from 2017 to 2021 and the labeled time-series Sentinel-1 patch dataset are available in a publicly accessible repository. If these datasets are used, please cite this publication. The “Paddy Rice Maps South Korea (2017 ~ 2021)” data are available at https://github.com/Agri-Hub/Callisto-Dataset-Collection.