
Figures & data
Figure 1. a) Location map with polar stereographic coordinate (EPSG 3413) of Godthåbsfjorden, NS and Nuuk in Greenland. b) Geocoded average amplitude image of COSMO-SkyMed SAR observations showing study area. Selected points (P1-P6) for analysis of multiyear ice velocity were marked with various color schemes. The dashed line is a centerline of the NS along the selected points. c) Variation of the annual terminus location of the NS using a product of the NASA MEaSUREs program (Joughin et al. Citation2021). d) a relative variation of the terminus retreat of NS with respect to the terminus position in 2013.
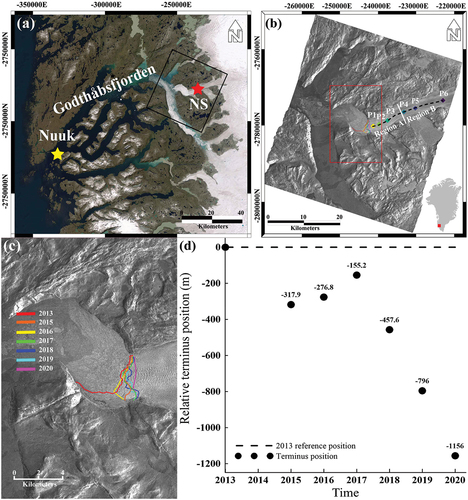
Table 1. Characteristics of the SAR observations used in this study.
Figure 2. Flowchart to estimate glacier velocity using the offset tracking approach with three datasets of SAR observations composed of TSX/TDM, CSK, and Sentinel-1. Considering the ice speed dependent on the period between two observations, adjustable window patch size according to spatial resolution of each SAR satellite should be selected.
Figure 3. (a-g) Average ice velocity map of NS during April – June from 2014 to 2020. The velocity map indicated that the glacier might have a typical flow pattern reflecting ice surface elevation (around the red dot circle area in region A).
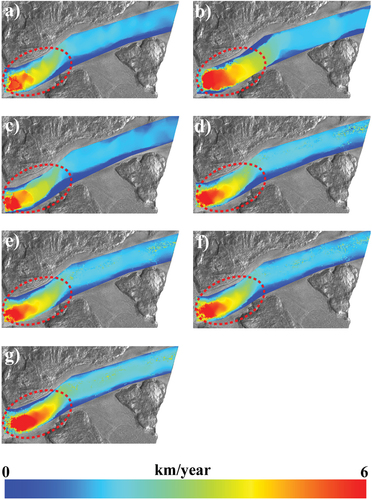
Figure 4. Average ice velocity from 2014 to 2020 during April – June along the centerline which is marked in . A traverse line of glacier surface height extracted from the GIMP DEM and its derivative (slope) was plotted to examine the relationship between the elevation change and the ice speed of the glacier. The ice velocity increased dramatically at approximately 9 km from the terminus.
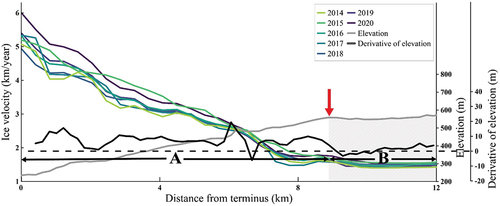
Figure 5. A time series of the ice velocity from points P1-P6, air temperature, SST, and LST for seven years. P1-P3 belongs to region A, and P4-P6 belongs to region B. The dashed line indicates a trendline showing the variation at each point. The variation from 2018 to 2020 was a relatively complicated pattern due to the more acquisitions with a short revisit cycle of the Sentinel-1 SAR satellite.
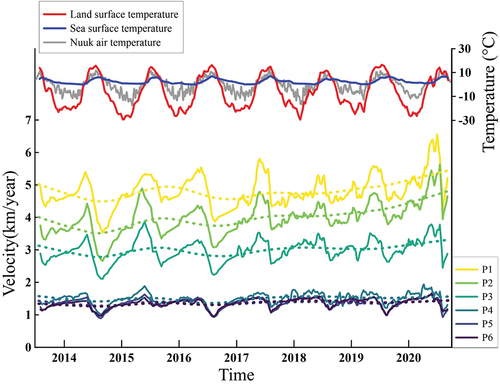
Figure 6. Plots to validate constructed time series of the ice velocity with the PROMICE dataset with cross mark derived from Sentinel-1 SAR offset tracking approach. The PROMICE dataset is available from October 2016.
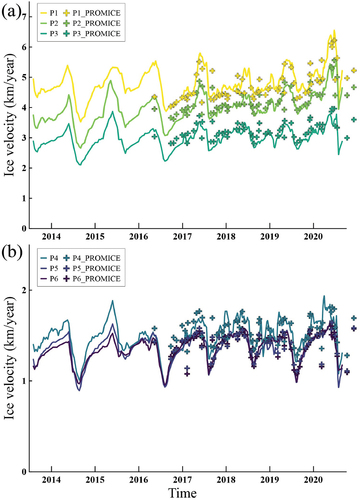
Figure 7. The plots showing the STL decomposition analysis. P1-P3 belongs to region A, and P4-P6 belongs to region B. The seasonal (red), trend (blue), residual (green) component and the ice velocity (orange) were displayed. The seasonal component was determined on a one-year cycle basis.
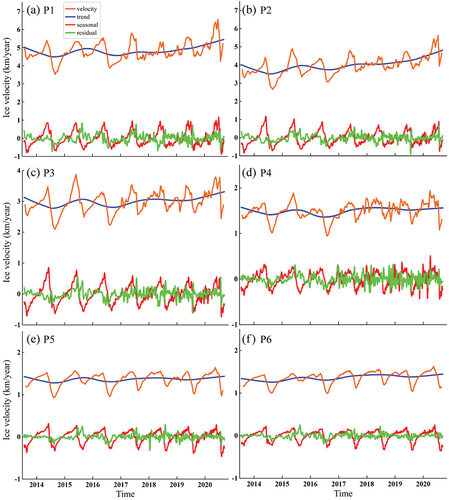
Figure 8. (Continued).
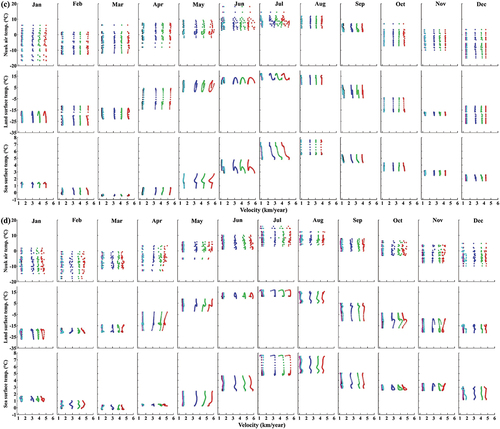
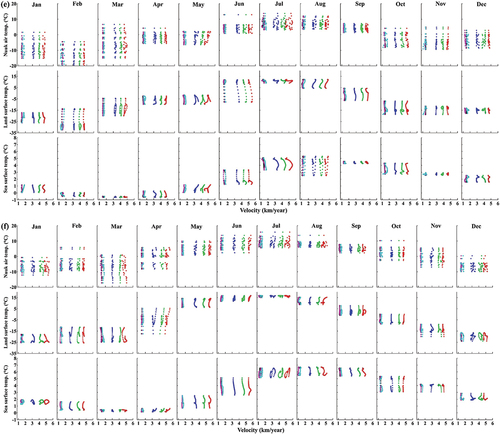
Figure 8. (a-f) Plots between ice velocity and temperature (air, land surface, and sea surface) on P1-P6. The color schemes of the plot are red, green, blue, cyan, magenta, and black at the P1 to P6, respectively.
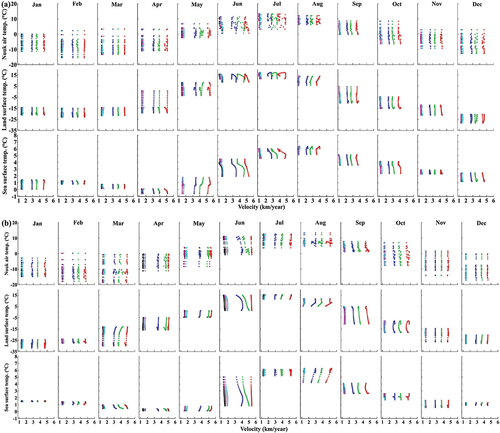
Figure 8. (Continued).
Supplemental Material
Download MS Word (798.6 KB)Data availability statement
The data that support the findings of this study are available from the corresponding author, SHH, upon reasonable request.