Figures & data
Figure 1. (a) Yunnan, a global biodiversity hotspot region, located in southwestern China. (b) The elevation map of the Yunnan. (c) Eight distinct floristic sub-regions of Yunnan as basic unit for classification (Li et al. Citation2015).
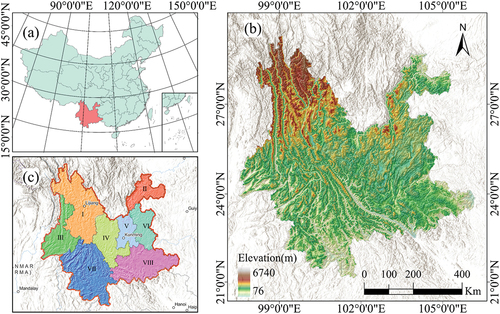
Figure 2. Valid observations of Sentinel-2 images in different periods. (a) 2016.1 to 2016.12; (b) 2015.7 to 2017.12; (c) 2016.1 to 2020.12.
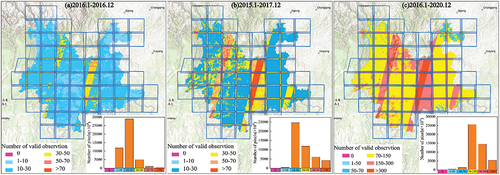
Table 1. Observed class and its acronym.
Figure 3. Technique workflow of research.
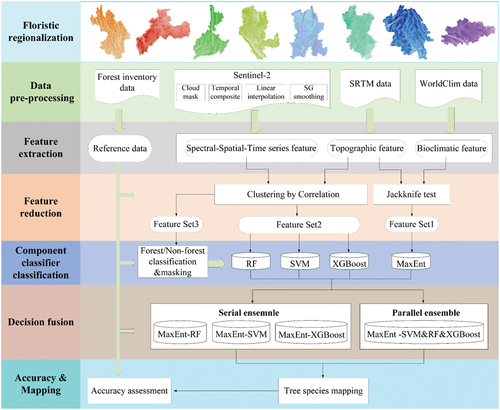
Figure 4. The number of samples for each observed class.
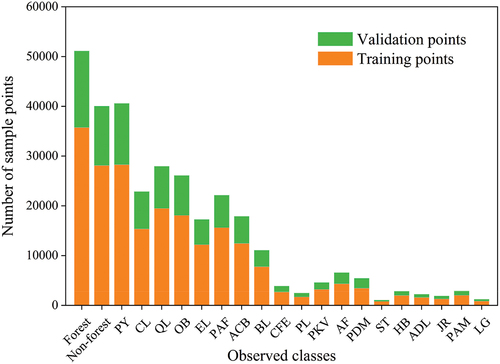
Table 2. The vegetation indices and corresponding formulas used in this study.
Table 3. The feature candidates for the forest mask generation.
Table 4. The feature candidates for forest stand species classification.
Figure 5. Schematic diagram of two decision fusion strategies.
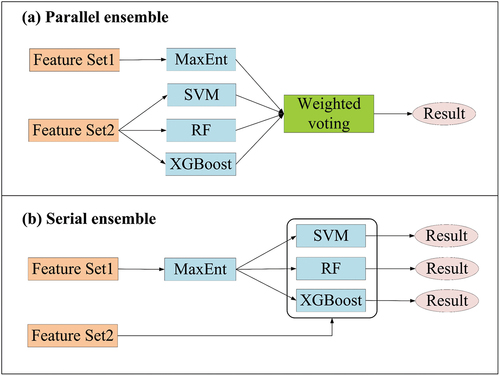
Table 5. Feature-classifier combinations explored in this study.
Figure 6. The numbers of optimal features and overall accuracies in the 8 sub-regions. Darker red tones mean higher accuracy for species classification.
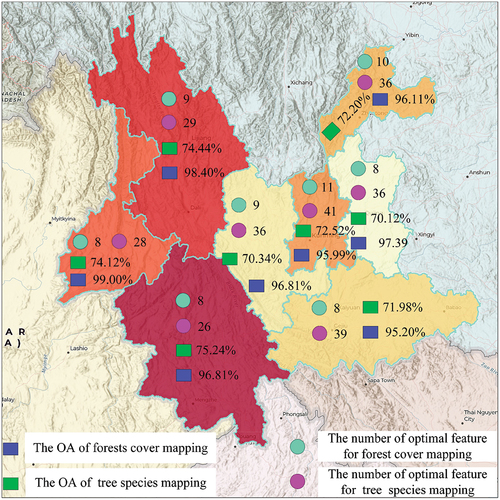
Figure 7. Forest/non-forest classification result of Yunnan province.
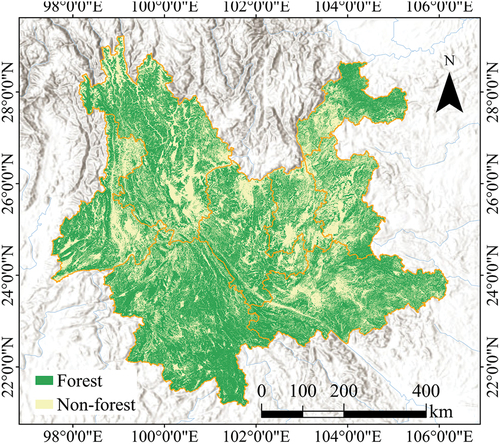
Table 6. Accuracy assessment for different classification scenarios in each sub-region. The highest accuracies over all sub-regions are in bold.
Figure 8. The spatial details of the forest stand species map in Yunnan Province in 2016. Site a (103.279°E, 26.851°N); Site b (103.626°E, 25.910°N); Site c (103.031°E, 25.434°N); Site d (104.568°E, 23.026°N); Site e (101.347°E, 21.946°N); Site f (99.173°E, 25.318°N); Site g (99.688°E, 27.743°N).
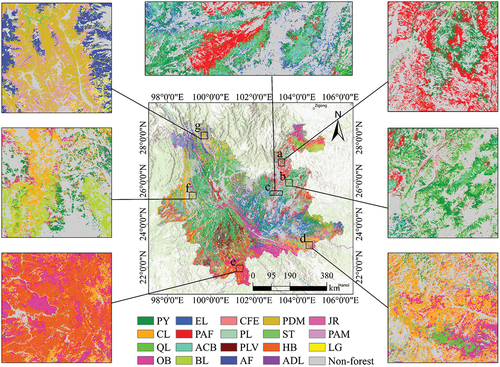
Figure 9. Confusion matrix heatmap of tree species classification.
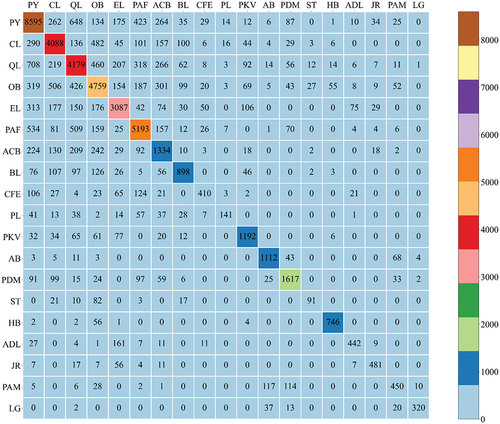
Figure 10. The mean spectral reflectance of 19 tree species, calculated from the Sentinel-2 bands.
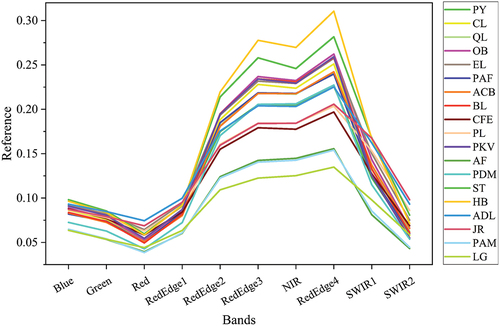
Figure 11. JM distances between species with (a) spectral bands and vegetation indices shown in , (b) spectral features and texture features, and (c) spectral features and time series features.
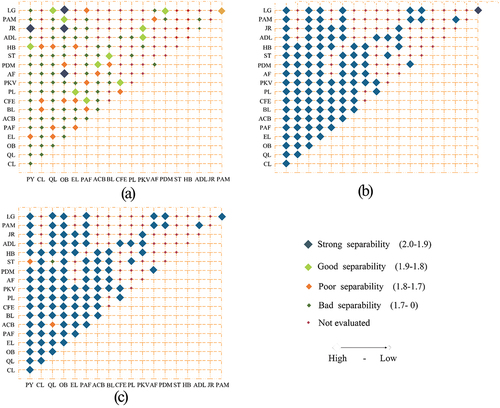
Figure 12. Distribution map of forest stand species in the altitude range.
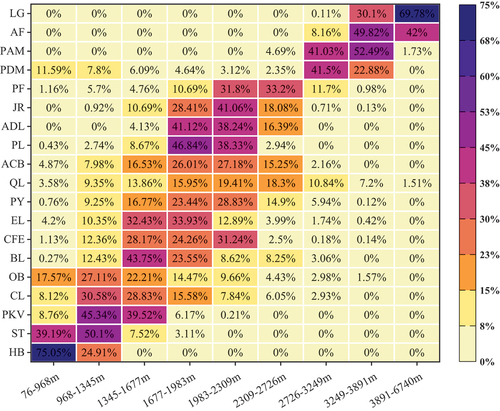
Table 7. Comparison of classification accuracies of different methods in each sub-region.
Figure 13. The spatial details of classification results in forest stand species. (a) Original image, (b) the Forest Management Inventory data, (c) M classification, (d) ROPT classification, and (e) MR classification.
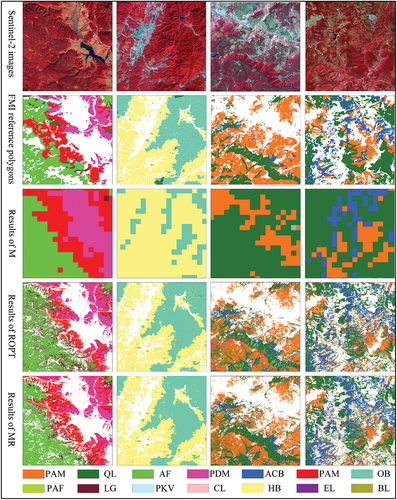
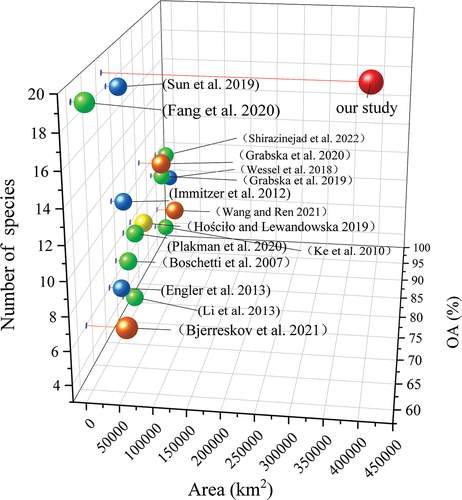
Figure 14. Brief review on research cases in tree species classification.