
Figures & data
Figure 1. The framework for retrieval and validation of the LAI profiles derived from DHP, TLS, ALS, and GEDI.
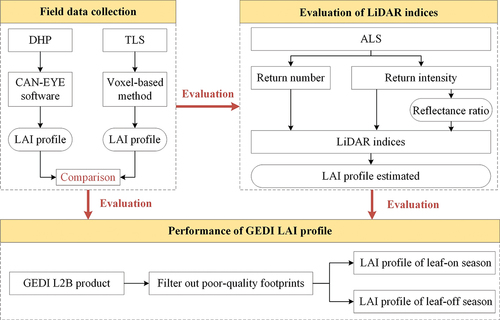
Figure 2. The location of the study area. The left panel (a) shows the locations of all measurements and the GEDI footprints (Background Google Earth Image obtained by CNES/Airbus on June 29, 2018). The right panel shows two field pictures taken near a measurement tower (42°24′N, 117°18′E, yellow triangle in (a) during (b) leaf-on (September 6, 2020) and (c) leaf-off (April 24, 2021) seasons, respectively.
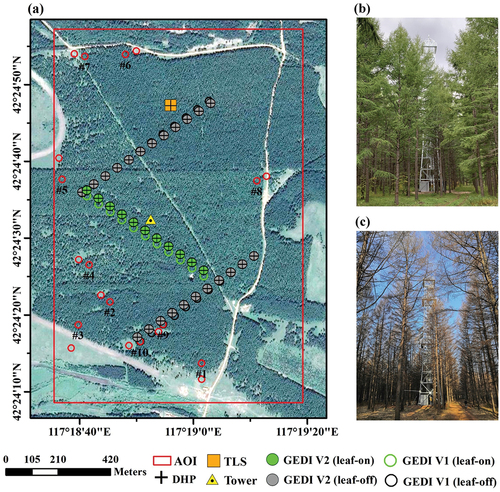
Figure 3. (a) The sampling strategy within a plot with five elementary vertical sampling points (VSPs) located at the center and four cardinal points, respectively; (b) a diagram of the portable measurement system at different heights (1.5–13.5 m) with 2 m interval; (c) field pictures were taken at 1.5–13.5 m with 2 m interval, respectively, on September 9, 2020. The upward DHP is within the red circle.
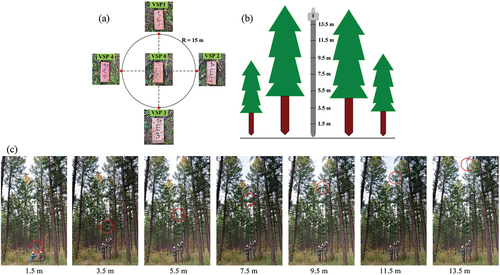
Table 1. DHP, TLS, ALS, and GEDI data used in the study. N is the number of plots for DHP and TLS and the number of footprints for GEDI, respectively.
Figure 4. Upward DHP images acquired at different heights (1.5–13.5 m) with 2 m interval from the same vertical sampling point (VSP) in (a) leaf-on season (September 8, 2020) and (b) leaf-off season (April 25, 2021), respectively.
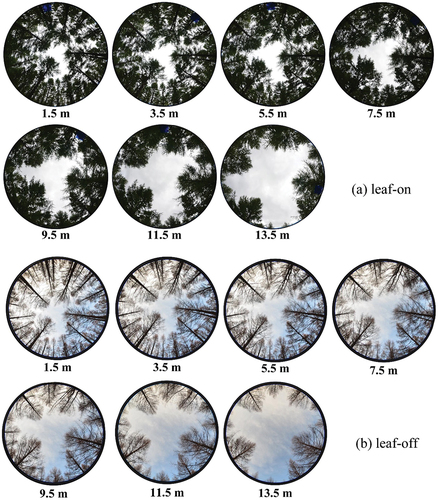
Table 2. The parameters of airborne LiDAR system and flight.
Table 3. Various LiDAR indices derived from the ALS return number and intensity*.
Figure 5. Relationships between the DHP layered and cumulative LAI (September 2020 and 2021) and various ALS (September 2018) indices from the training data. (a-c) and (g-i) the canopy fractional cover indices from return (FCIR), intensity (FCIInt), and both (FCIRI), respectively; (d-f) and (j-l) the above and below ratio indices from return (ABRIR), intensity (ABRIInt), and both (ABRIRI), respectively. The vertical color bar in (a) and (g) indicates the different heights for layered LAI and cumulative LAI, respectively. The index values are normalized to 0–1. The black line represents the regression line.
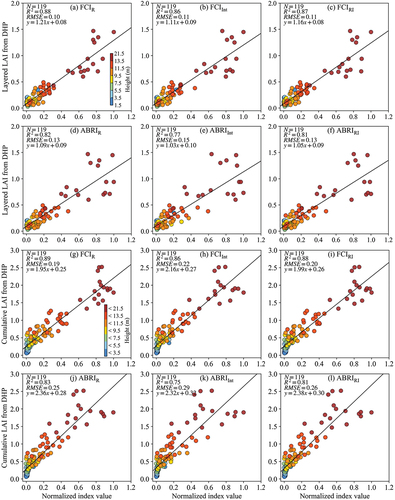
Figure 6. Comparison of the layered LAI estimated from ALS (September 2018) with the validation DHP data (September 2020 and 2021) during the leaf-on season. (a-c) 34 plots with the Beer-Lambert method; (d-i) 17 plots with the linear regression method.
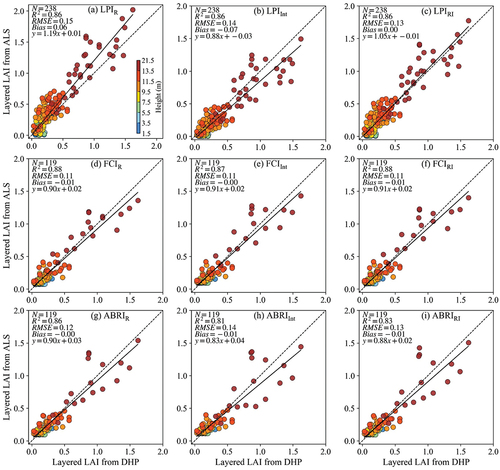
Table 4. Comparison of statistics between the LAI profiles derived from various ALS indices () and those from DHP (34 plots, 238 heights) during the leaf-on season.
Figure 7. Comparison of the cumulative LAI estimated from ALS (September 2018) with the validation DHP data (September 2020 and 2021) during the leaf-on season. (a-c) 34 plots for Beer-Lambert; (d-i) 17 plots for linear regression method.
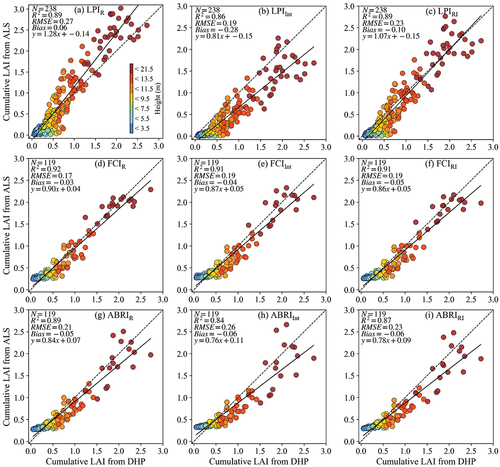
Figure 8. Comparison of the layered LAI derived from ALS (September 2018) and TLS (September 2020) during the leaf-on season.
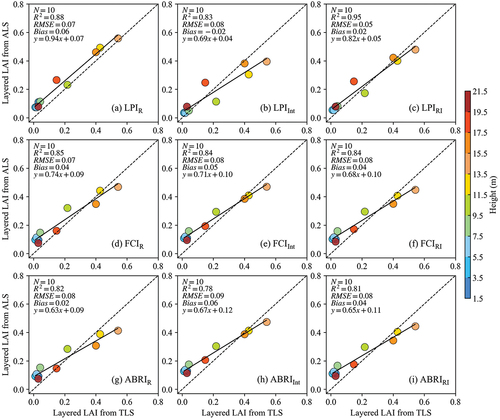
Figure 9. Vertical LAI maps (1 km × 1.5 km) Figure 2derived from the ALS using LPIRI (September 2018) over the study area (red box in ).The color bar indicates the LAI values.
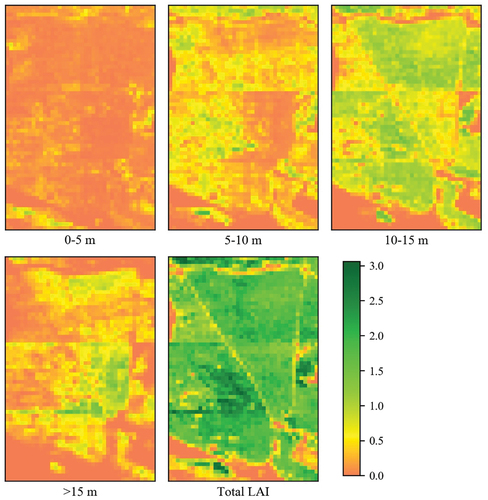
Figure 10. The vertical LAI profiles derived from (a) DHP (September 2020 and 2021) and ALS (September 2018) during the leaf-on (34 plots) and leaf-off (23 plots in April 2021) seasons, and (b) TLS and GEDI V2 during the leaf-on (1 plot for TLS in September 2020, and 11 plots for GEDI in August 2020) and leaf-off (23 plots for GEDI in May 2019) seasons. The ALS LAIs were derived from LPIRI. The line and shades represent the mean and standard deviation values, respectively. Subscripts “on” and “off” indicate the leaf-on and leaf-off seasons, respectively.
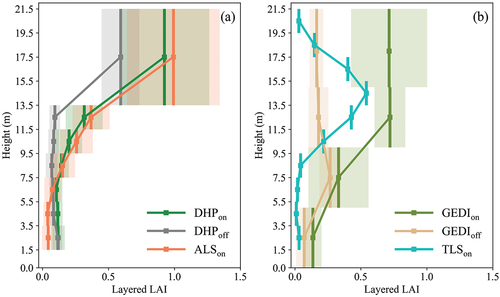
Table 5. The mean LAI at different heights and the total LAI obtained from DHP, TLS, ALS, and GEDI V2 at different seasons, respectively. The ALS LAIs were derived from LPIRI. The values of the standard deviations are shown in the brackets. All LAI profile data are from .
Figure 11. Comparison of the layered LAI at (a) all heights, (b) 0–15 m, and (c) > 15 m and (d) the cumulative LAI derived from GEDI V2 (August 2020) with the DHP measurements (September 2021) during the leaf-on season (11 plots).
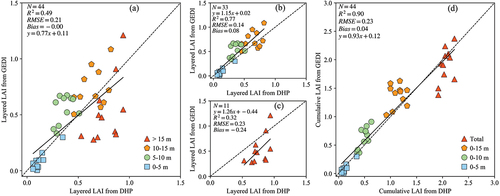
Figure 12. Comparison of the layered LAI at (a) all heights, (b) 0–15 m, and (c) > 15 m and (d) the cumulative LAI derived from GEDI V2 (May 2019) and DHP (April 2021) during the leaf-off season (23 plots).
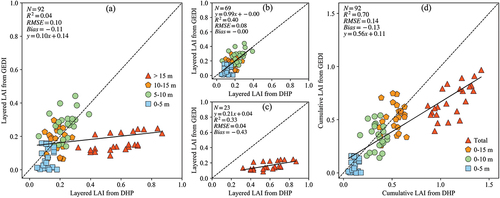
Figure 13. Comparison of the cumulative LAI derived from ALS (September 2018) and GEDI V2 (August 2020) during the leaf-on season (11 footprints).
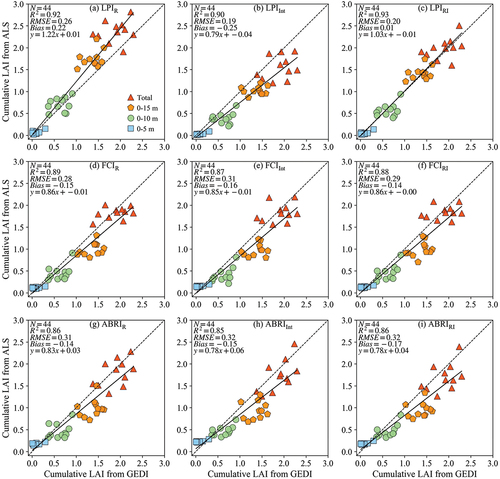
Figure A1. An example intensity image (in raw digital number) for 3 pairs of adjacent footprints (#1, #9 and #10) selected from . Left: bare ground returns; right: forest returns. The average return intensity of each footprint is shown in the lower right corner.
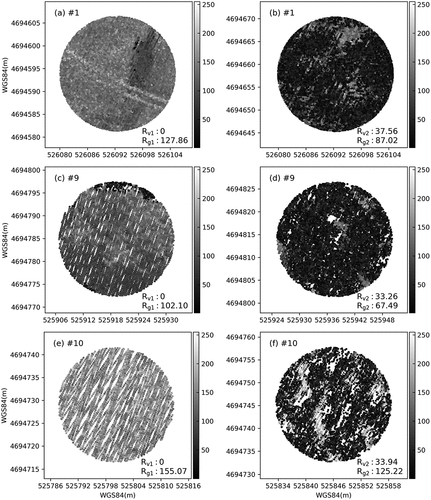
Table A1. The average return intensities (in raw digital number) for ρv/ρg calculated from 10 pairs of adjacent footprints (). The values of the standard deviations are shown in the brackets.
Figure B1. (a) The vertical LAI profiles derived from TLS (September 2020) and DHP (September 2021) during the leaf-on season. (b) The scatterplot between the TLS and DHP. The subscript “on” indicates that the data were obtained in the leaf-on season.
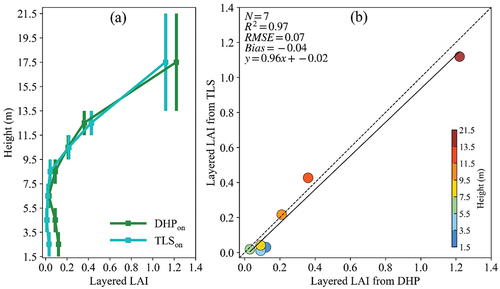
Figure B2. Comparison of the layered (a) and cumulative (b) LAI profiles derived from GEDI V2 (August 2020) and TLS (September 2020) during the leaf-on season.
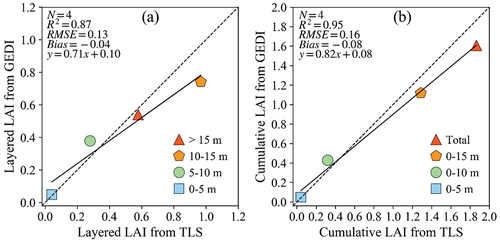
Figure C1. The 2 m LAI profiles derived from the GEDI V2 waveform data during the leaf-on (11 footprints) and leaf-off (23 footprints) seasons.
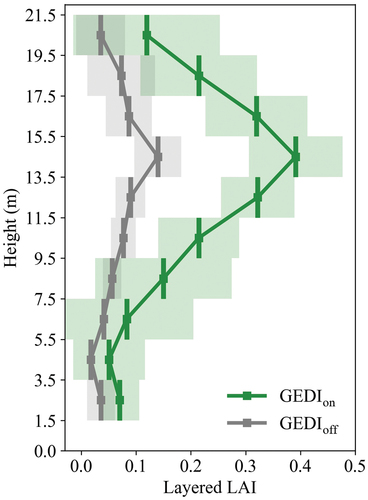
Table C1. The mean and total LAI values obtained from the 2 m GEDI LAI profiles (Figure C1). The standard deviation values are shown in the brackets.
Table D1. Typical field measured canopy and ground reflectance ratio (ρv/ρg) for different species used in the RAMI-IV during the leaf-off season* (Widlowski et al. Citation2015). The last row shows the mean (standard deviation) of the values.
Supplemental Material
Download (2.1 MB)Data availability statement
The field measurement data in this study are available from the corresponding author, Y.W., upon reasonable request.