
Figures & data
Figure 1. Study area for the tree species classification within the ARF, with FRI sites denoted with respect to model training and validation. Background is a true-color composite of the area from WV2 imagery for 10 August 2014. The grid coordinates correspond to the reference system NAD 1983 (2011) UTM zone 17N.
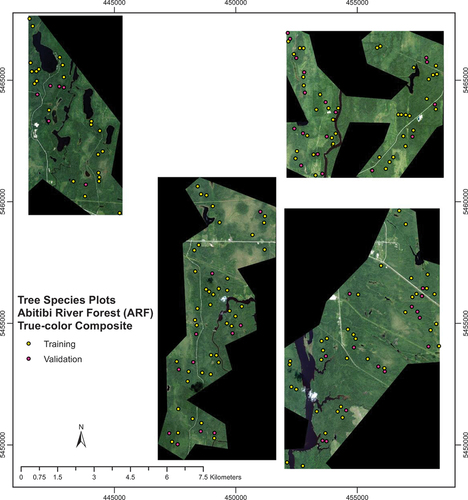
Figure 2. Variable importance for the tree species classification, ranked by mean decrease in Gini, as ascertained from the RF model.
Table 1. Accuracies of the tree species classification methods, in terms of percent correct classification (accuracy) and Cohen’s kappa, when models were tested on the validation set. Accuracies are reported at both the pixel level, and the aggregated site level.
Figure 3. Prediction map for most probable tree species groupings for the ARF study region, as determined from the RF model.
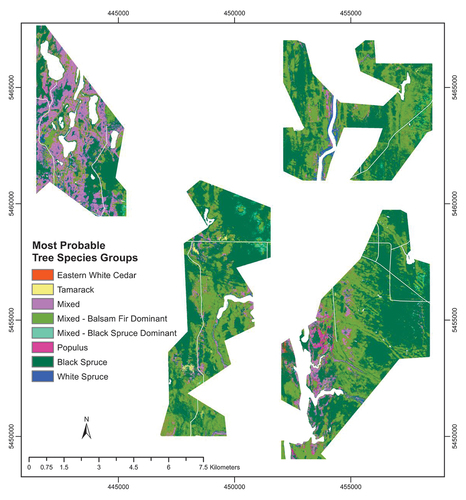
Table 2. Confusion matrices for the tree species classification from the RF model, for counts aggregated at the site level. Counts are reported for the training (top) set corresponding to 143 sites, and validation (bottom) set corresponding to 57 sites, respectively. Producer’s accuracy (PA) and user’s accuracy (UA) are also reported for each tree species grouping class.
Table 3. Uncertainty calculations with respect to entropy (1) and normalized entropy from the top 2 choices (4), summarized by tree species grouping, for the validation set sites.
Figure 4. Entropy map for uncertainty of prediction, as calculated by (1), for the ARF study region. Darker color intensity indicates lower prediction uncertainty, whereas lighter color intensity corresponds to higher uncertainty with prediction.
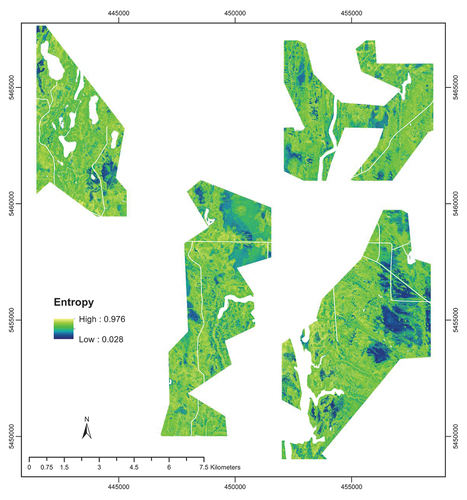
Figure 5. Normalized entropy from the top two choices of tree species groupings, as calculated by (4), for the ARF study region. Darker color intensity indicates lower prediction uncertainty, whereas lighter color intensity corresponds to higher uncertainty with prediction.
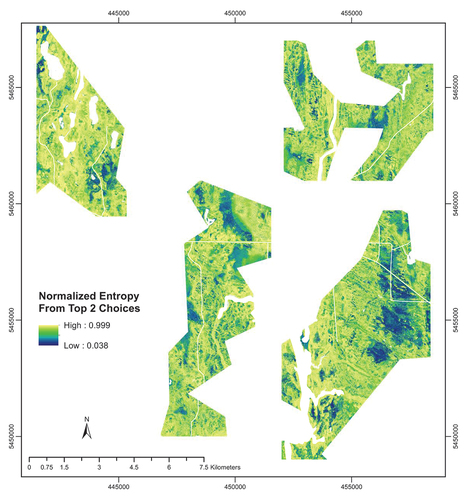
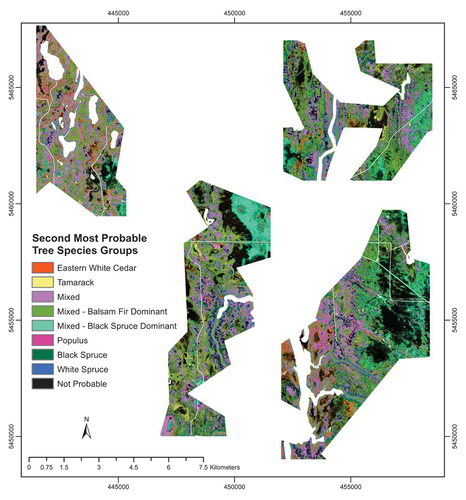
Figure 6. Prediction map for second most probable tree species groupings for the ARF study region, as established by the RF model.
Data availability statement
The LiDAR-derived feature data that support the findings of this study is openly available in figshare at https://dx.doi.org/10.6084/m9.figshare.21282675. The satellite imagery data are not publicly available.