
Figures & data
Figure 1. Geographical location and topography of the study area. The insets (a) and (b) show the area percentage of forested regions with different slope levels in the HDMR and footprints of the 36 Landsat scenes covering the study area, respectively. (c) high-resolution Google Earth images and the LandTrendr-derived NBR pixel-based trajectories, which are used for visual validation of the detected forest disturbances, at three representative sites (A, B and C). DEM data used here are sourced from the Shuttle Radar Topography Mission V3 (SRTM−3) in GEE.
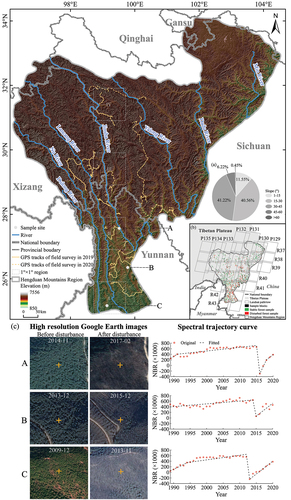
Figure 2. A flowchart of detecting and filtering forest disturbances and simulating topography-induced disturbances. α, β, θ, Ω and i denote slope, aspect, solar zenith angle, solar azimuth angle and solar incidence angle, respectively.
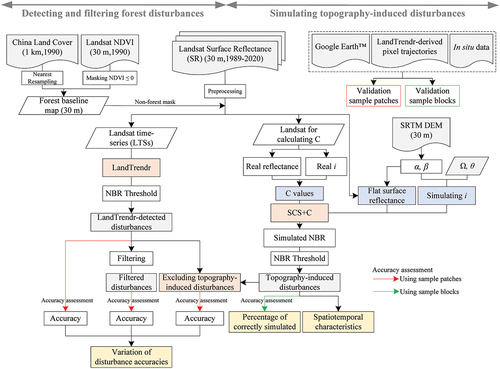
Table 1. The percentages of actually stable and disturbed forested areas in the overlapping areas between topography-induced disturbances simulated by the SCS+C model and LandTrendr-detected forest disturbances.
Figure 3. Spatiotemporal pattern of all topography-induced disturbances simulated by the SCS+C model in the forested regions of the HDMR and zoomed-in images of two typical sites (D and E). DOYs i−j indicate the potential disturbances caused by the differences in topographic effects between DOY i and DOY j.
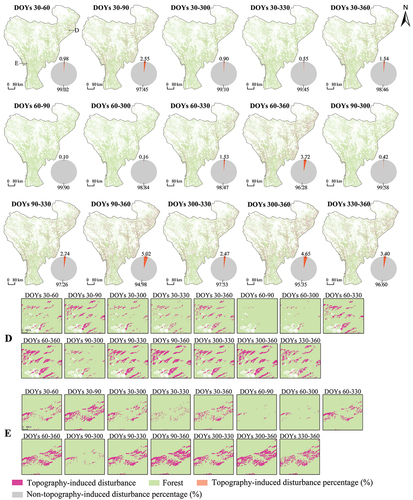
Figure 4. Variations in the areas of all topography-induced disturbances simulated by the SCS+C model with slopes and aspects in the forested regions of the HDMR. DOYs i−j indicate the potential disturbances caused by the differences in topographic effects between DOY i and DOY j.
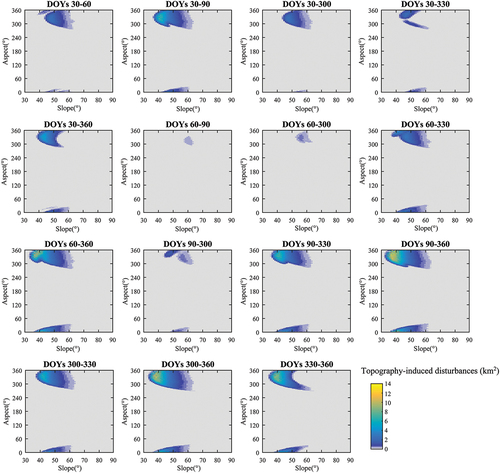
Figure 5. Results of propensity score matching and one-way ANOVA. The standardized mean differences (SMDs) of slopes and aspects between the examined regions and the t-statistics and p value before and after propensity score matching are presented in (a), (b) and c), respectively; (d) illustrates the number of topography-induced disturbances and the significance tests using one-way ANOVA of the five matching results. Regions I−IV are presented in . *** means p < 0.001.
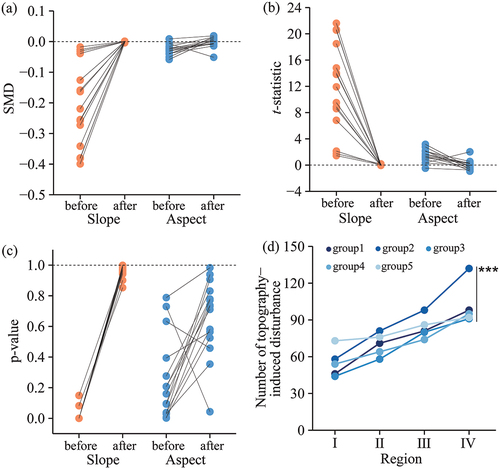
Table 2. Accuracy results of forest disturbances in the HDMR from 1989 to 2020 before and after excluding topography-induced disturbances.
Figure 6. Forest disturbances in the HDMR from 1989 to 2020 before and after excluding topography-induced disturbances. (a) LandTrendr-detected forest disturbances, (b) topography-induced disturbances generated from the SCS+C simulation, (c) the resultant forest disturbances after excluding topography-induced disturbances, (d) magnified images of four typical sites (F, G, H, and I) in (a), and (e) LandTrendr temporal segment trajectories of representative points (+) of four typical sites in (d). Topography-induced disturbances in F, G, and H were successfully removed from the LandTrendr-detected forest disturbances, whereas actual forest disturbances in I were incorrectly removed.
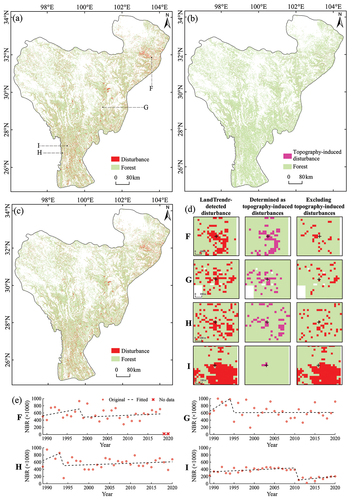
Figure 7. Variations in areas and accuracies of forest disturbances generated by filtering LandTrendr-detected forest disturbances with different patch sizes before and after excluding topography-induced disturbances. (a) LandTrendr-detected forest disturbances, (b) forest disturbances after excluding topography-induced disturbances, and (c) forest disturbances occurring in the regions with topography-induced disturbances. Filtered patch size 0 indicates no filtering; filtered patch size i (i.e. 1–10) indicates that disturbance patches containing the number of pixels with an 8-connected rule greater than i were retained. OA, PA, and UA represent the overall accuracy, producer’s accuracy, and user’s accuracy based on the area-adjusted confusion matrix method, respectively.
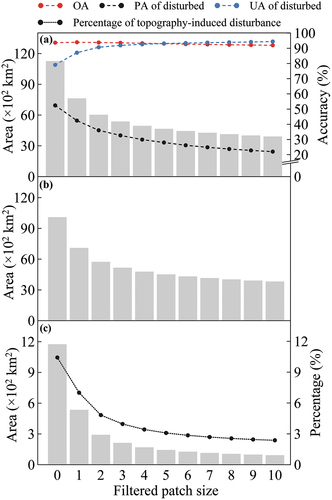
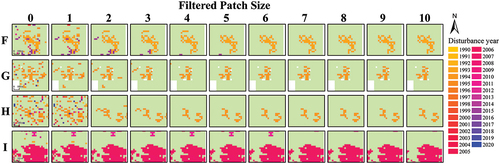
Figure 8. Zoomed-in images of forest disturbances generated by filtering with different patch sizes. Four typical sites (F, G, H, and I) are marked in . Filtered patch size 0 indicates no filtering; filtered patch size i (i.e. 1–10) indicates that disturbance patches containing the number of pixels with an 8-connected rule greater than i were retained.
Data availability statement
The China Land-Use/Cover datasets are available in the Resource and Environment Science and Data Centre at https://www.resdc.cn/data.aspx?DATAID=197. All the Landsat images and SRTM DEM that support the findings of this study are available in the Google Earth Engine platform at https://developers.google.com/earth-engine/datasets/catalog/landsat and at https://developers.google.com/earth-engine/datasets/catalog/USGS_SRTMGL1_003?hl=en, respectively.