
Figures & data
Figure 1. The Bavarian Forest National Park. a) Yearly bark-beetle-infested areas based on aerial imagery. b) the location of the Bavarian Forest National Park and the adjacent Šumava National Park in Central Europe.
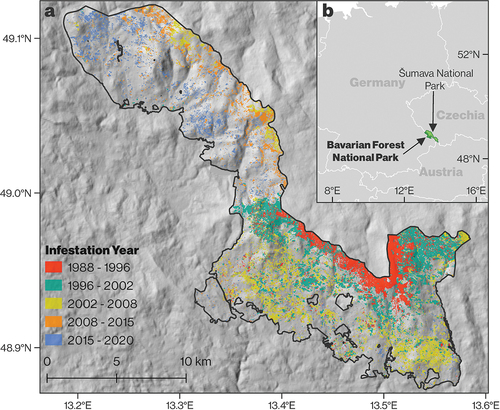
Figure 2. Time series of area infested by bark beetles in the BFNP. Columns represent yearly increase in infested areas, and lines/dots the cumulative infested area. The study period is marked by the grey box. Infested areas that have been left standing, which were used in this study, are colored in blue.
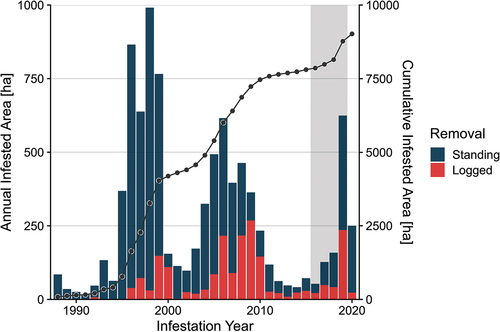
Figure 3. Workflow of the methods used in this study. Gray boxes indicate the datasets, and white boxes the applied methods.
Table 1. Overview of the vegetation indices computed from the Landsat and Sentinel-2 data. ρ represents the reflectance in a given band.
Table 2. Overview of the indices computed from the SAR imagery. σ represents SAR backscatter in dB and linearly scaled SAR backscatter.
Figure 4. Sampling design as exemplified for one pixel representing an infested area in 2018. The red line represents the changes in NBR values for one example pixel infested in 2018 over time. The left (right) gray column indicates the period covering the sampling of values representing healthy (infested) forest. The infestation occurred during the period represented by the orange box.
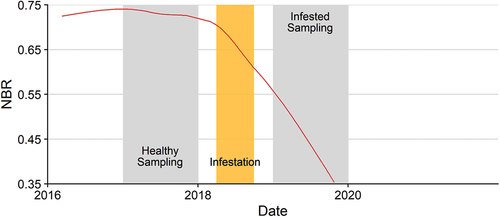
Table 3. Infestation Onsets for the Investigated Years, as derived by using PhenIps.
Figure 5. Jeffries-Matusita distance for all computed vegetation indices. For the abbreviations of the indices, see .
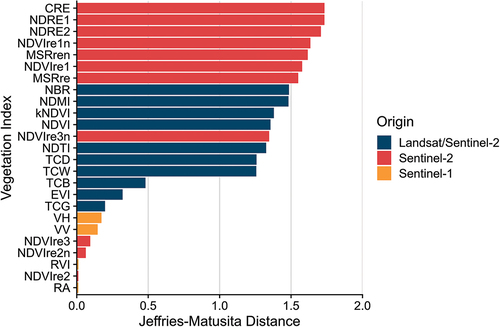
Figure 6. Value distributions between healthy and infested forests for the three indices selected for processing: a) CRE, b) NBR, c) VH. Dashed lines represent the probability density functions derived from the data for the Bayesian probability computations.
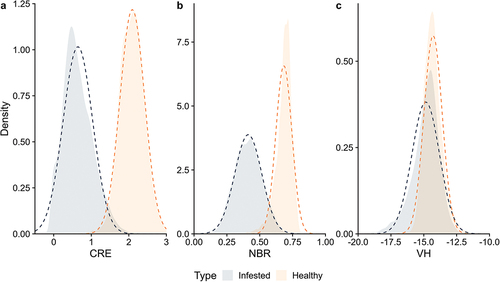
Figure 7. Overall accuracy (a), omission error (b), omission error of the infested class (c) commission error for the infested class based on the Bayesian approach.
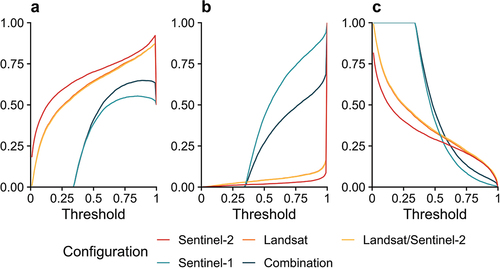
Figure 8. Overall accuracy (a), omission error (b), omission error of the infested class (c) commission error for the infested class based on the random forest approach.
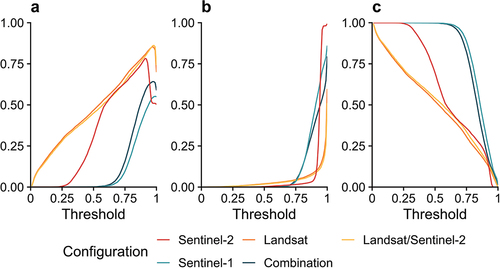
Table 4. Confusion Matrix for the Classification using the Sentinel-2 configuration with the Bayesian approach based on the CRE and a probability threshold of 0.98.
Table 5. Optimal thresholds and overall accuracies (OA) for every sensor configuration and approach.
Figure 9. Patch-size-specific spatial accuracies for the Sentinel-2 configuration based on the Bayesian approach: a) overall accuracy, b) omission error for the infested class, c) commission error for the infested class. The gray dashed lines represent the accuracy/errors regardless of patch size, as shown in .
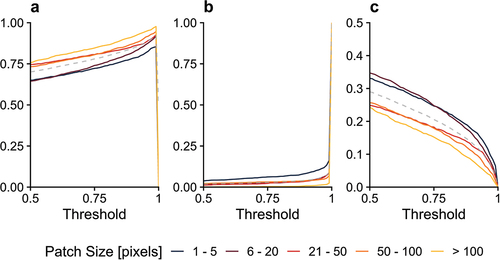
Figure 10. Distribution of values regarding the timeliness of detection for all sensor configurations based on the Bayesian approach (a) and the random forest approach (b). All dates are standardized to days since the beginning of the bark beetle infestation in the respective year.
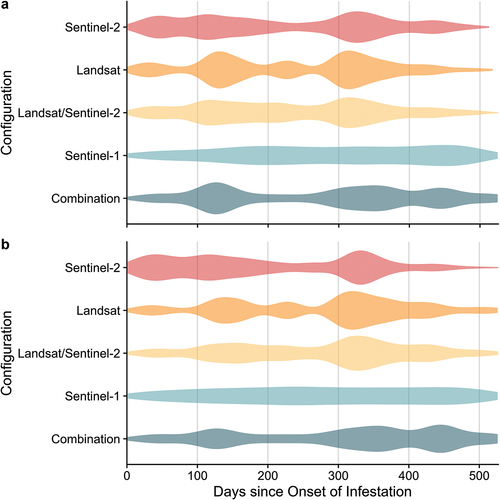
Figure 11. Distribution of values regarding the timeliness of detection for the years 2016–2019, as determined using the Sentinel-2 random forest configuration.
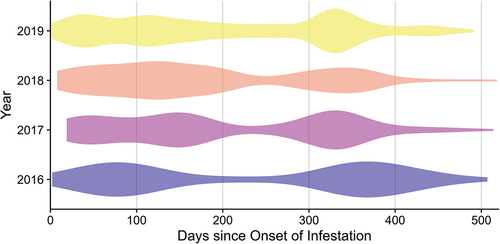
Figure 12. Distribution of values regarding the timeliness of detection in patches of different sizes for the years 2016–2019, as determined using Sentinel-2 random forest configuratio
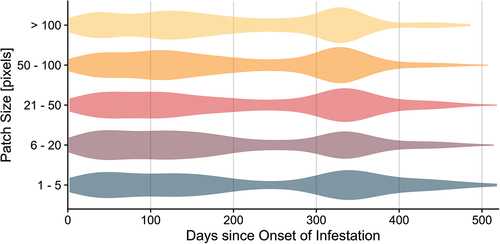
Figure 13. Distribution of values regarding the timeliness of detection according to three different probability thresholds (0.5, 0.75, 0.9), as determined using the Sentinel-2 random forest configuration.
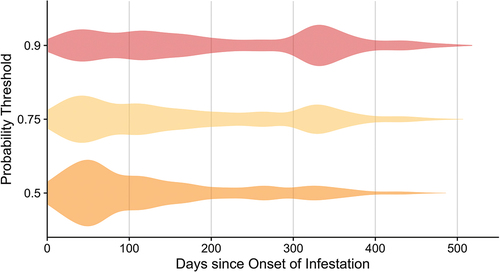
Figure 14. Final infestation map for the Bavarian Forest National Park. Colors represent the detection date based on the Sentinel-2 configuration using the CRE and the Bayesian approach with a probability threshold of 0.98. The black box indicates the subset illustrated in .
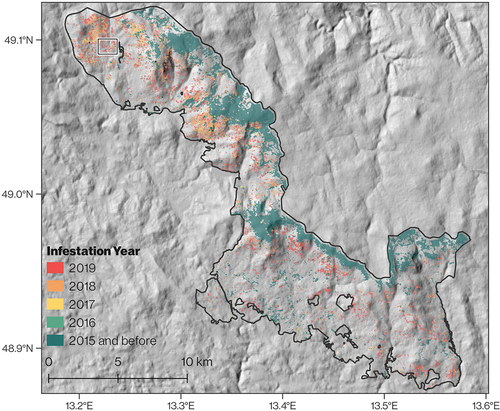
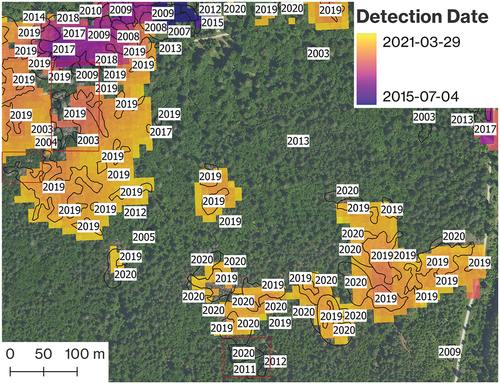
Figure 15. Subset of the infestation map for an area in the northwest region of the BFNP. Polygons represent the disturbance patches in the reference data, labeled according to the infestation year in each one. The three red rectangles delineate areas that were not successfully detected. The satellite-based assessment agreed well with the ground data.
Supplemental Material
Download MS Word (1.8 MB)Data availability statement
The data that support the findings of this study are available from the corresponding author, S.K., upon reasonable request.