
Figures & data
Figure 1. The location of the study area. (a) Location of Beijing; (b) Geography of Beijing Plain; (c) Location of SAR datasets.
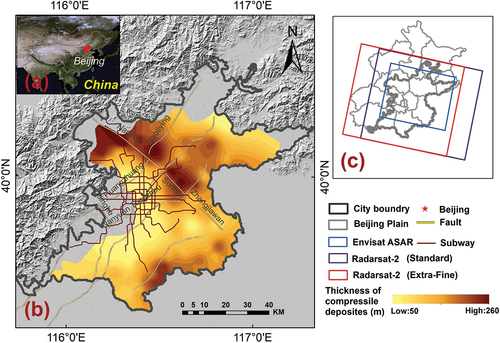
Table 1. Main information of the Envisat ASAR and Radarsat-2.
Figure 2. Flowchart of methodology.
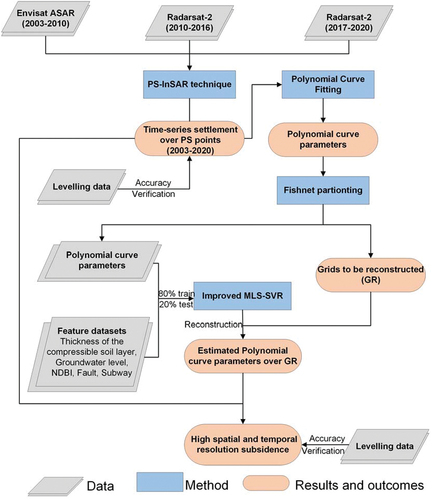
Figure 3. Flowchart of identification of NoData grids. The yellow grids have no PS points and time series deformation need to be reconstructed.
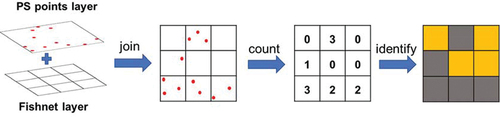
Figure 4. Deformation rate derived from (a) Envisat ASAR (2003–2010), (b) Radarsat-2 (2010–2016) and (c) Radarsat-2 (2017–2020); (d) time series fusion during 2003–2020.
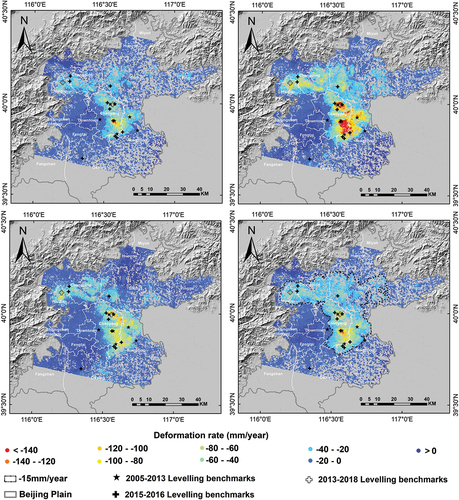
Figure 5. Comparison of deformation derived from PS-InSAR and levelling observations. (a) Scatter plot of deformation derived from PS-InSAR and levelling observations during 2006–2013 and 2015–2016. (b, c) Time series deformation during 2003–2020.
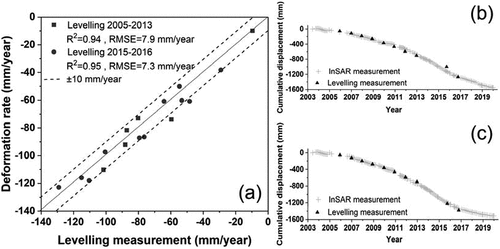
Figure 6. (a) R2 and (b) RMSE of fitted cumulative deformation derived from linear, quadratic, cubic and quartic fitting.
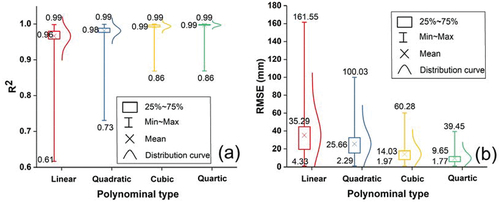
Figure 7. Time-series cumulative deformation modelled by cubic polynomial fitting curve for (a) Point A and (b) Point B.
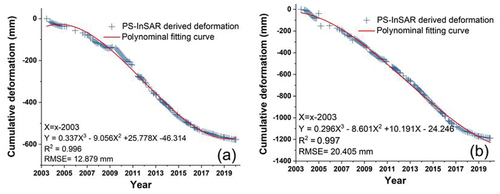
Figure 8. Spatial distribution of four correlation coefficients (a) , (b)
, (c)
and (d)
.

Table 2. Points at different scale grids.
Figure 9. Spatial distribution of the grids with and without PS measurements in subsidence area.
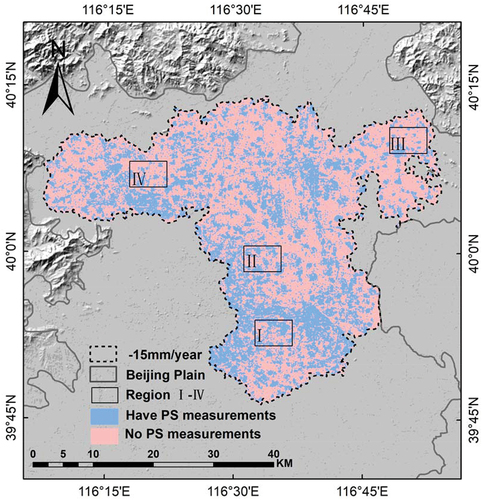
Figure 10. (a) Spatial distribution of five clusters clustered by ISODATA; (b) R2 and (c) RMSE of the estimated ,
,
, and
.
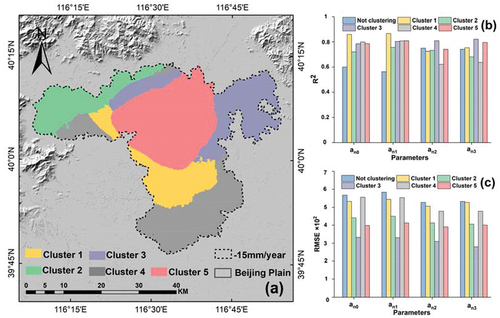
Figure 11. (a) RMSE and MAPE of reconstructed deformation of test samples with different deformation rate. (b) Scatterplots of cumulative deformation the improved MLS-SVR against that derived from PS-InSAR from 2003–2020. (c) and (d) Cumulative deformation time series reconstructed by MLS-SVR and derived from PS-InSAR of two test samples. (e) and (f) Cumulative deformation time series reconstructed by MLS-SVR and measured from levelling measurements.
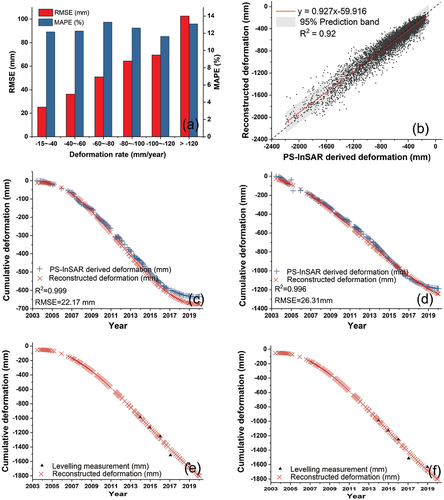
Figure 12. Comparison of cumulative deformation reconstructed by IDW Ordinary Kriging and the improved MLS-SVR after removing PS points in (a-c) Region I, (d-f) Region II, (g-i) Region III and (j-l) Region VI. Scatterplots of reconstructed cumulative deformation from (m) IDW, (n) Ordinary Kriging and (o) Improved MLS-SVR against PS-InSAR measurements.
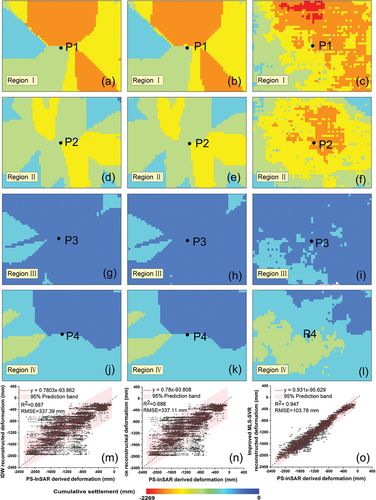
Figure 13. Comparison the time-series deformation between measured from PS-InSAR and reconstructed from IDW, Ordinary Kriging, and Improved MLS-SVR on point (a-d) P1-P4.
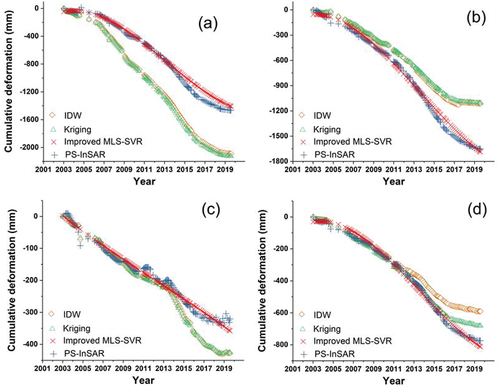
Figure 14. Cumulative deformation of (a) PS points derived from PS-InSAR, (b) NoData grids derived from MLS-SVR, and (c) the subsidence area merged by (a) and (b); (d, g, j, m) are PS points in Region I-IV; (e, h, k, n) are NoData grids in in region I-IV; (f, i, l, o) are the merged results in Region I-IV.
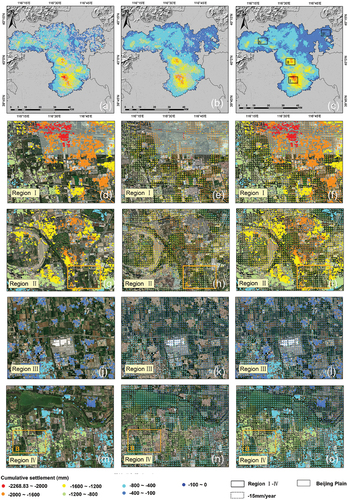
Figure 15. Cumulative deformation of (a, d) PS points derived from PS-InSAR, (b,e) reconstruction final result in Area a and Area B. (c, f) Profile analysis in regions a and B.
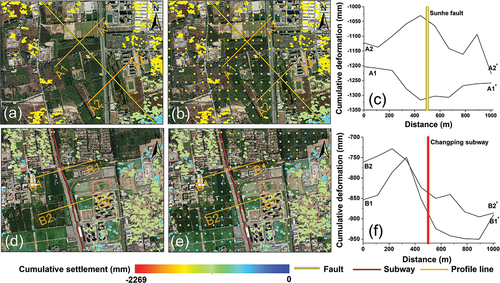
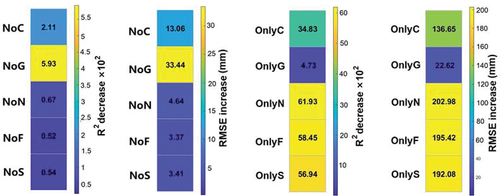
Figure 16. The change of R2 and RMSE of cumulative deformation after removing one feature type (NoC- No compressib layer; NoG-No Groundwater; NoN-No NDBI; NoF-No Fault; NoS-No subway;) or with only one feature type (OnlyC-Only compressib layer; OnlyG-Only Groundwater; OnlyN-Only NDBI; OnlyF-Only Fault; OnlyS-Only subway).
Supplemental Material
Download MS Word (49.8 MB)Data availability statement
Upon reasonable request, the corresponding author, Professor Xiaojuan Li, Ph.D., can provide the data that support study’s conclusions.