
Figures & data
Figure 1. Specific study areas in three Chinese cities: (a) Beijing, (b) Shanghai, and (c) Guangzhou.
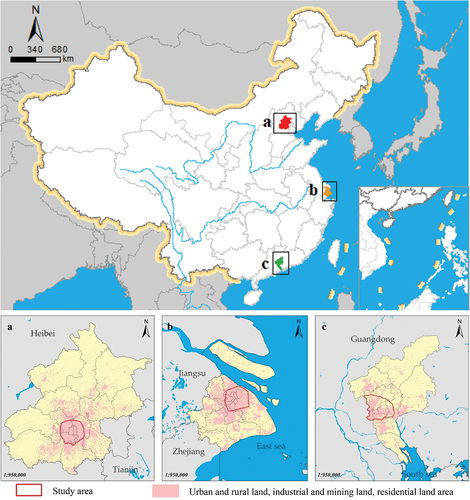
Table 1. Experimental data sets.
Figure 2. Paper structure.
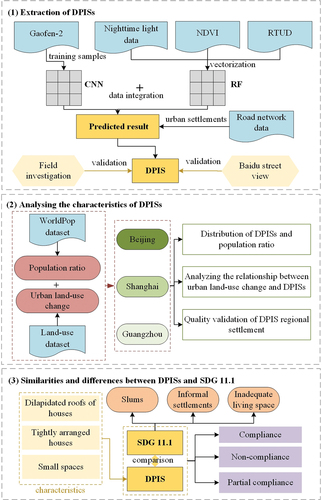
Figure 3. Accuracy of different models.
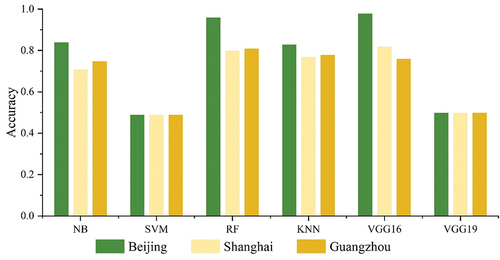
Figure 4. Informal settlement identification based on multi-source geographic information data.
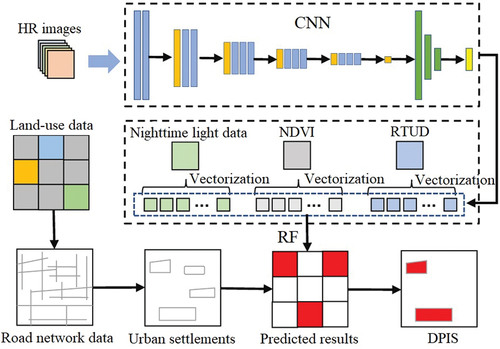
Figure 5. Architecture of the VGG16 network.
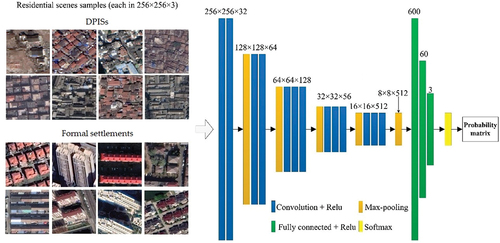
Figure 6. Characteristics of informal settlements in Gaofen images. (a) dilapidated houses. (b) high-density distribution. (c) Disorderly distribution.
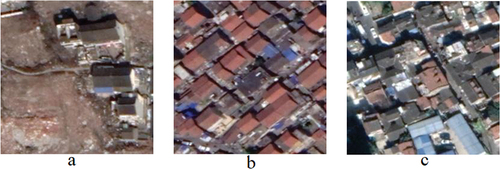
Figure 7. Spatial distribution of densely populated-informal settlements (DPISs) in the study areas: (a) Beijing, (b) Shanghai, and (c) Guangzhou. The background of the map is from Gaode map (https://www.amap.com/).
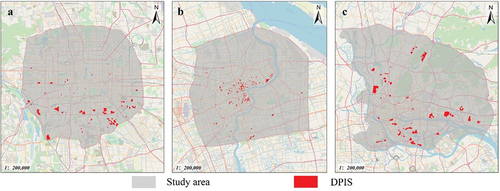
Figure 8. Densely populated-informal settlements and formal settlement (FS) images obtained from Gaofen-2 satellite images.
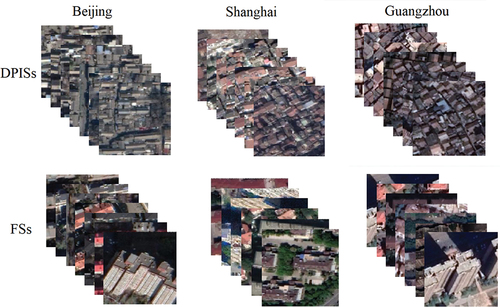
Figure 9. Areas, total population, and density statistics of DPISs in the study area.
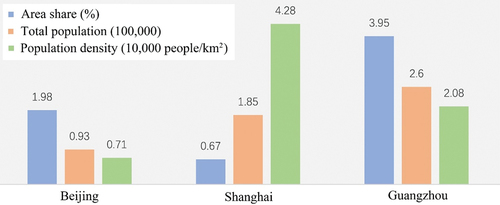
Figure 10. Urban land-use changes and DPIS distribution in the study areas from 1980 − 2020: (a) Beijing, (b) Shanghai, and (c) Guangzhou.

Figure 11. Comparison of land-use changes in DPISs in three cities: Beijing, Shanghai, and Guangzhou.
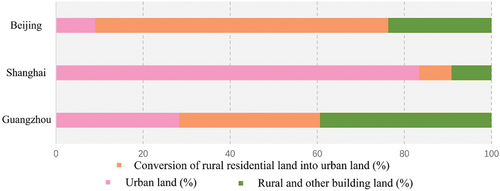
Figure 12. Distribution of normalized difference vegetation index (NDVI), night lighting, and real-time Tencent user density (RTUD) in different types of settlements in (a) Beijing, (b) Shanghai, and (c) Guangzhou.
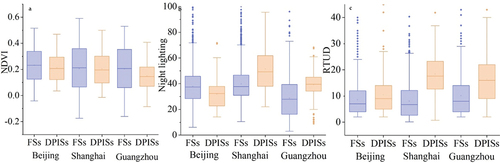
Figure 13. Field investigation photo records and Baidu Street Views of DPISs in 2019. (a) and (b) Wanping city, Beijing. (c) and (d) Shikumen, Shanghai. (e) and (f) South side of Huangpu District, Guangzhou.
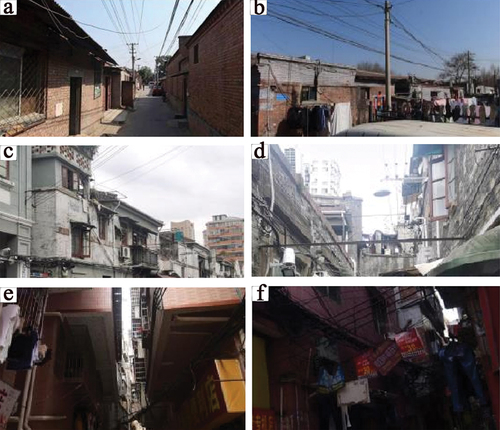
Table 2. Characteristics of settlements defined in sustainable development Goal (SDG) 11.1 and densely populated‒informal settlements (DPISs).