
Figures & data
Figure 1. Location of the Geum River. (a) downstream, (b) midstream, and (c) upstream of the Geum River in the Republic of South Korea.
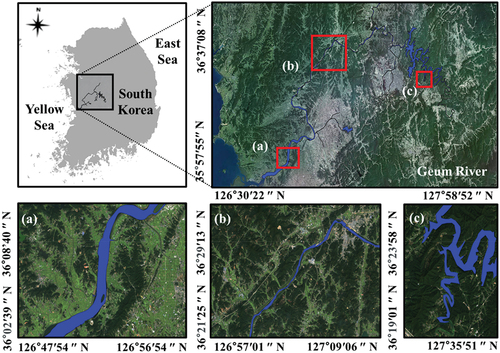
Figure 2. Research flowchart to achieve SR from LR imagery by using the deep learning-based SR algorithms for acquiring the fine-resolution map of Chl-a distribution; (a) indicates the image process of preparing LR and HR input data; (b) denotes the application of deep learning-based SR including SRCNN and SRGAN models; (c) is the SR image generation performance evaluation of SRCNN and SRGAN and generation of the Chl-a distribution maps.
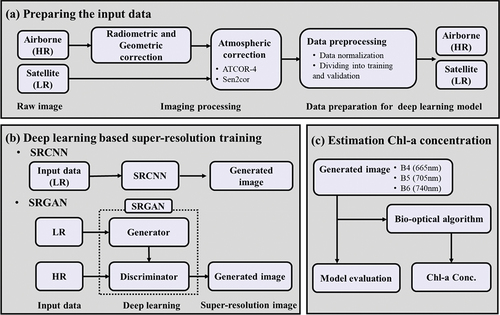
Figure 3. Description of the SRCNN and SRGAN model; (a) is the SRCNN model, (b) and (c) indicate the generator and discriminator in the SRGAN model, respectively.
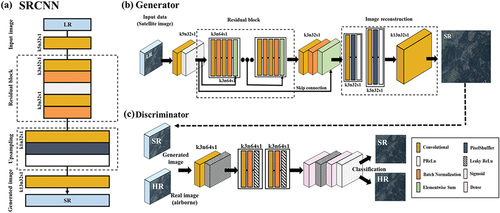
Figure 4. The reflectance spectra range from 465–955 nm in the Geum River. The dash-dot line represents the highest and lowest reflectance values for September 30, 2019. The Solid line with the blue marker indicates the mean reflectance values according to the satellite imagery bands (B01–B09) on the downstream (a, d, and g), midstream (b, e, and h), and upstream (c, f, and i) regions of the Geum River.
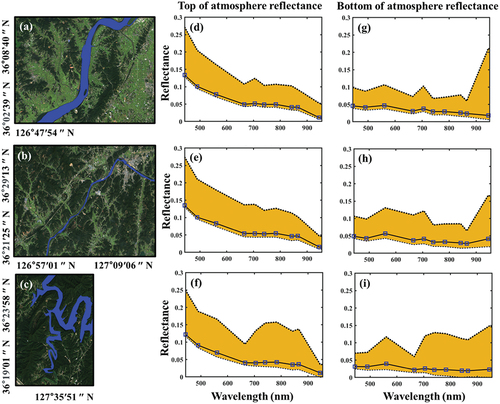
Figure 5. Reflectance spectra range from 465–955 nm in the Geum River. The dash-dot line represents the highest and lowest reflectance values for the October 24, 2020. The black line with the blue marker indicates the mean reflectance values according to the satellite imagery bands (B01–B09) on the downstream (a, d, and g), midstream (b, e, and h), and upstream (c, f, and i) regions of the Geum River.
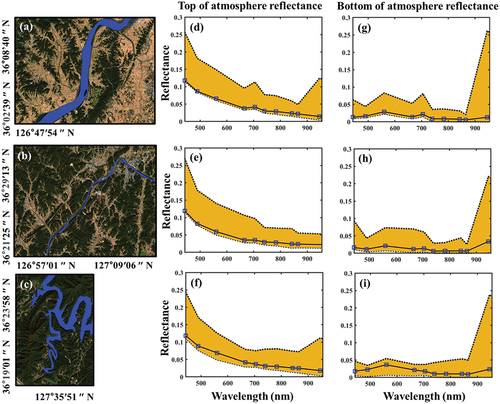
Figure 6. The quality training results of super-resolved representative area imagery. (a) is downstream, (b) indicates the midstream, and (c) represents the upstream of Geum river basin for the B04(665nm) on September 30, 2019. The red square indicates the zoom-in view of representative images by the SR methods. The red circles represent the checkboard artifact in the visual image results.
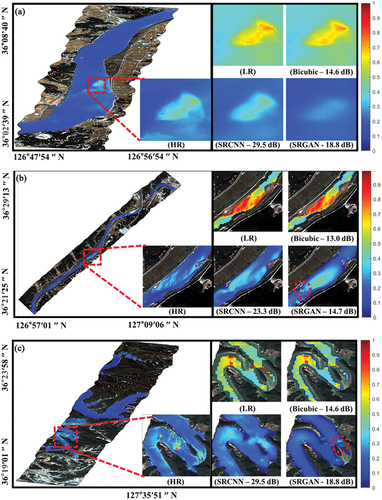
Figure 7. The quality training results of super-resolved representative area imagery. (a) is downstream, (b) indicates the midstream, and (c) represents the upstream of Geum river basin for the B05(705nm) on September 30, 2019. The red square indicates the zoom-in view of representative images by the SR methods. The red circles represent the checkboard artifact in the visual image results.
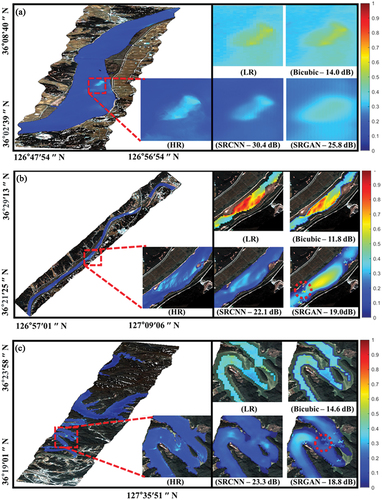
Figure 8. The quality validation results of super-resolved representative area imagery. (a) is downstream, (b) indicates the midstream, and (c) represents the upstream of Geum river basin for the B04 (665 nm) on October 24, 2020. The red squares indicate the zoom-in view of representative images by the SR methods. The red circles represent the checkboard artifact in the visual image results.
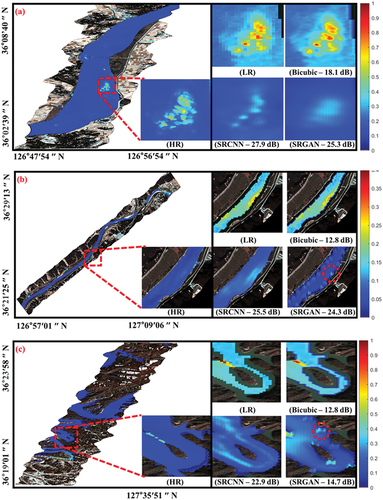
Figure 9. The quality validation results of super-resolved representative area imagery. (a) is downstream, (b) indicates the midstream, and (c) represents the upstream of Geum river basin for the B05(705 nm) on October 24, 2020. The red squares indicate the zoom-in view of representative images by the SR methods. The red circles represent the checkboard artifact in the visual image results.
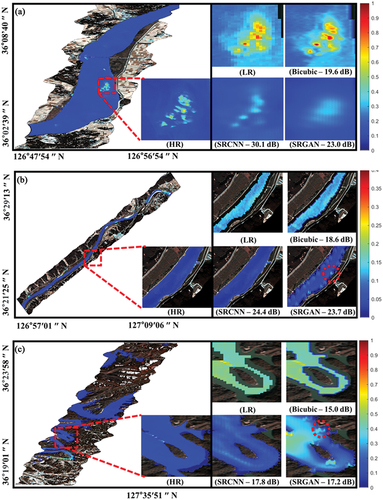
Table 1. Comparison of interpolation method, SRGAN, SRCNN, and HR images.
Figure 10. Spatial distribution maps of different SR algorithms were used to the band ratio (B05/B04) for estimation of the Chl-a concentration ratio. These maps indicate September 30, 2019, for the downstream (a–e), midstream (f–j), and upstream (k–o) of the Geum River.
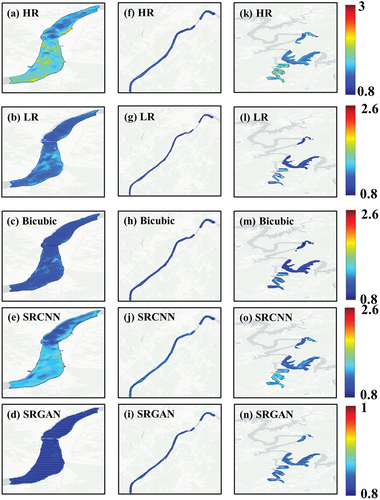
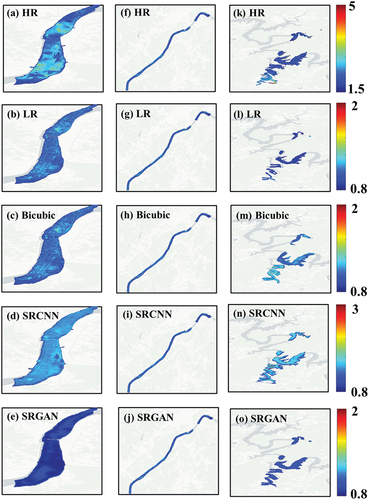
Figure 11. Spatial distribution maps of different SR algorithms were used to the band ratio (B05/B04) for estimation of the Chl-a concentration ratio. These maps indicate October 24, 2020, for the downstream (a–e), midstream (f–j), and upstream (k–o) of the Geum River.
Data availability statement
The data that support the findings of this study are available from the corresponding author, J.C.Pyo, upon reasonable request.