
Figures & data
Table 1. Data sources used in this study.
Figure 1. Climatic sub-regions in Chinese Mainland, locations of the in-situ SM sites, and six validation regions of interest (ROIs) under Asia North Albers equal area conic projection.
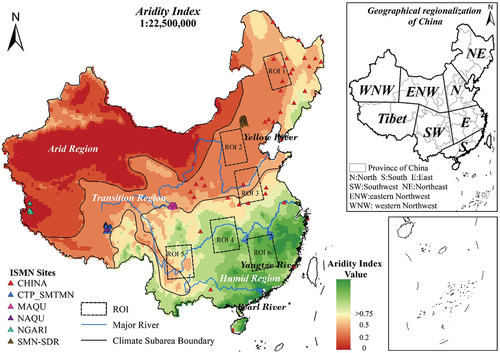
Figure 2. The flowchart to generate gap-filled SM and identify droughts utilizing the spatial-temporal analysis frame.
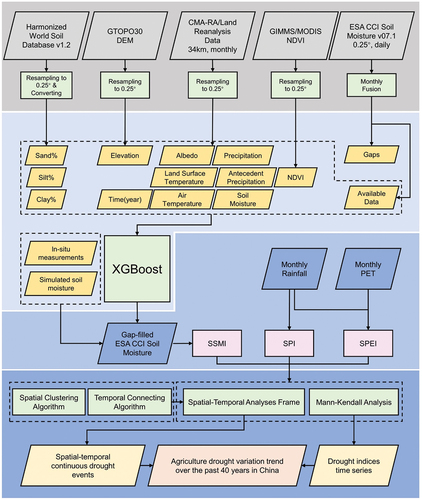
Table 2. Drought classifications according to the drought indices.
Figure 3. Schematic diagram of spatial-temporal analysis frame to identify drought events.
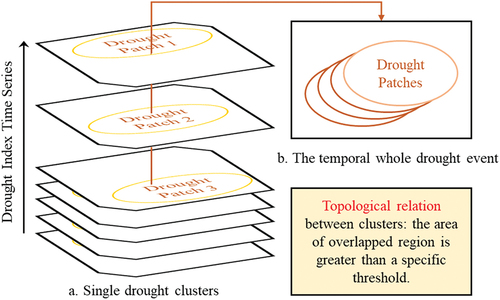
Figure 4. Comparisons of original and gap-filled CCI SM where the subfigures(a1), (a2), … , and (a6) are original CCI SM in May 1982, June 1990, July 1998, August 2006, September 2014, and October 2020, respectively; the subfigures (b1), (b2), … , and (b6) are gap-filled CCI SM corresponding to the gap-filled SM.
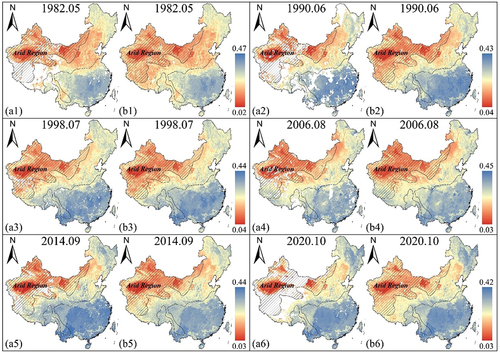
Figure 5. The comparisons between gap-filled SM and in-situ observed SM at six ISMN networks (CHINA, CTP-SMTMN, MAQU, NAQU, NGARI, SMN-SDR) with the metrics of (a) R, (b) RMSE, (c) ubRMSE, and (d) bias.
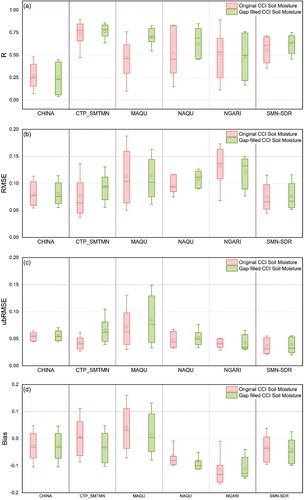
Figure 6. Scatterplots of the comparisons (a) between original SM and in-situ SM and (b) between gap-filled SM and in-situ SM.
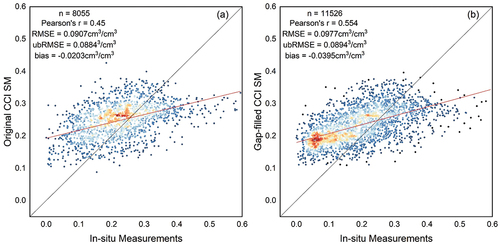
Figure 7. Scatterplots between the original and predicted CCI SM over the six man-made data gaps corresponding to the ROIs in fig. 1.
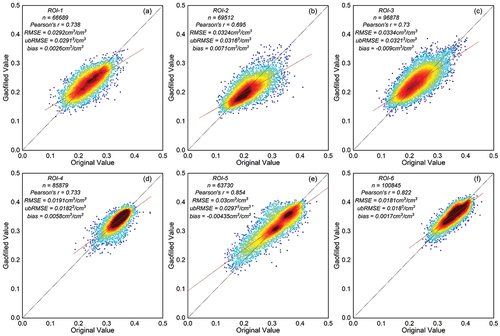
Figure 8. Spatiotemporal description of the 2011 drought event in South China based on the SSMI1-CCI index.
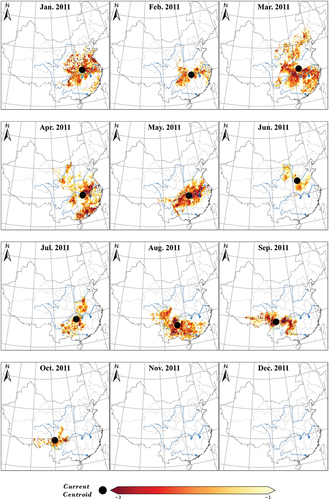
Figure 9. Spatiotemporal description of the 2011 drought event in South China based on the SPI3-CRA index.
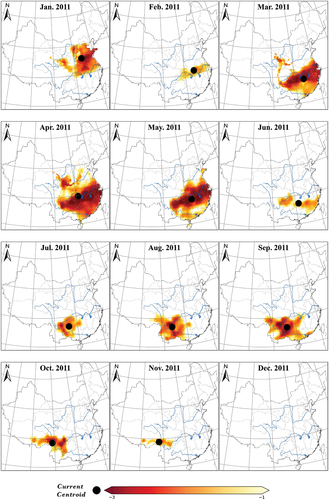
Figure 10. Spatiotemporal description of the 2011 drought event in South China based on the SPEI3-CRA index.
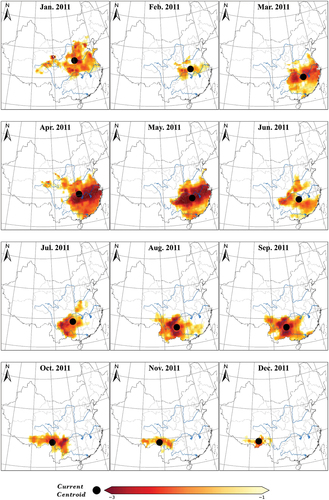
Figure 11. Intensity and affected area of the 2011 drought event in South China depicted by the SSMI, SPI, and SPEI indexes.
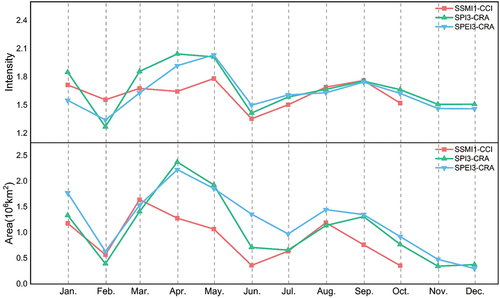
Figure 12. Correlation between the drought severity identified by SSMI1-CCI, SPI3-CRA, and SPEI3-CRA against the NDVI drought severity.
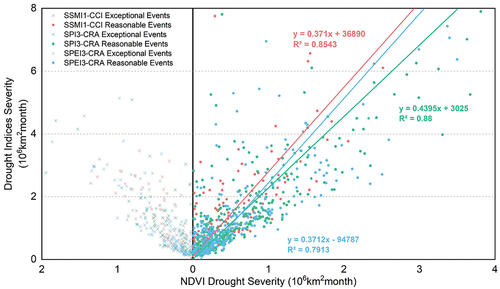
Figure 13. Spatially distributed frequencies of moderate, severe, extreme, and all droughts by the drought indexes of SSMI1-CCI, SPEI3-CRA, and SPI3-CRA.
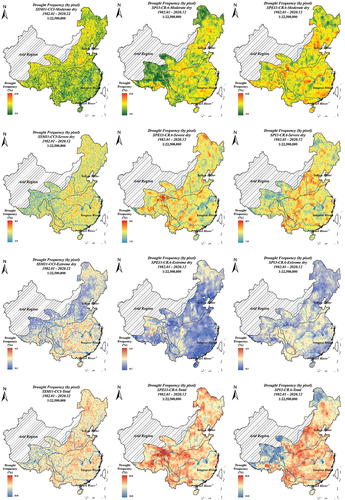
Figure 14. Statistics of the drought frequency over different regions of China, where (a) is the drought indicated by SSMI1-CCI, (b) is that by SPI3-CRA, and (c) is that by the SPEI3-CRA.
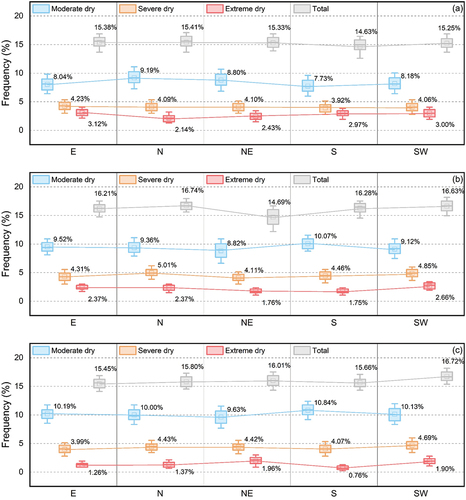
Figure 15. Spatial distribution of drought events during 1982–2020 identified by (a) SSMI1-CCI, (b) SPI3-CRA, and (c) SPEI3-CRA.
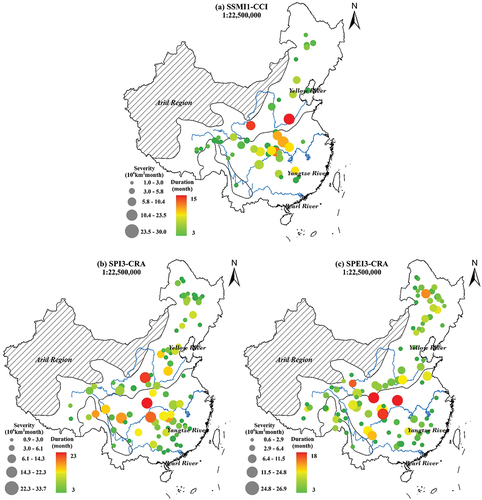
Figure 16. Temporal variation of drought severity during 1982–2020 based on (a) SSMI1-CCI, (b) SPI3-CRA, and (c) SPEI3-CRA.
Figure 17. Mann-Kendall analysis for varied drought indexes: (a) SSMI1-CCI, (b) SPI3-CRA, and (c) SPEI3-CRA.
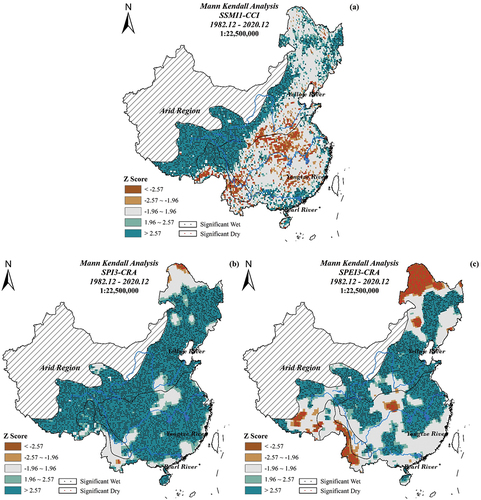
Figure 18. Statistic of drought disaster losses during 2006–2021 from “China Flood and drought disaster prevention Bulletin”.
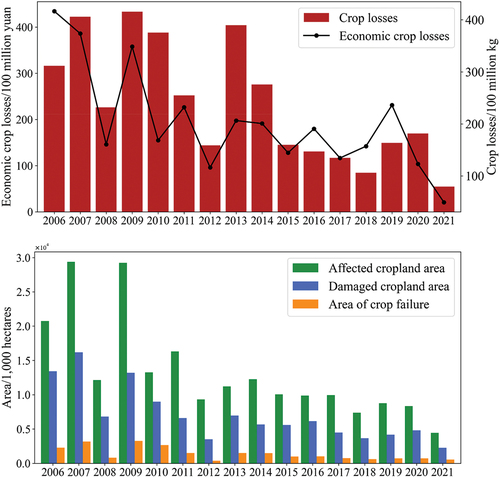
Table 3. Comparison between in-situ SM and SM predicted by GRU or XGBoost.
Figure 19. Importance of input variables in the gap-filling method depicted by the increased percentage of RMSE.
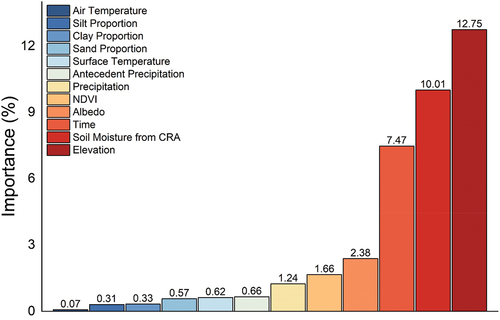
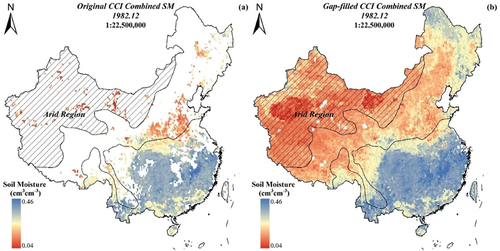
Figure 20. Visualization of the (a) original CCI SM and (b) gap-filled SM in December, 1982.
Data availability statement
The data supporting the findings of this research are publicly available at https://www.esa-soilmoisture-cci.org/data, https://doi.org/10.5067/MODIS/MOD13C2.006, https://developers.google.com/earth-engine/datasets/catalog/NASA_GIMMS_3GV0, http://data.cma.cn/data/cdcdetail/dataCode/NAFP_CRA40_FTM_MON_NC.html, https://www.fao.org/soils-portal/data-hub/soil-maps-and-databases/harmonized-world-soil-database-v12/en/, https://earthexplorer.usgs.gov/, https://ismn.earth/en/, https://www.scidb.cn/en/detail?dataSetId=434a6fad0daa4c32a7396dc7db575fc8.