
Figures & data
Figure 1. The study area and locations of the 334 samples in the city of Zhumadian.
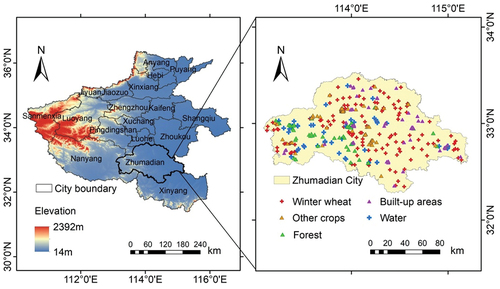
Table 1. The DOY and the corresponding number of acquired Sentinel-2 images from November 2019 to June 2020 in Henan Province.
Figure 2. Examples of the collected samples with true color composites of Sentinel-2 images for (a) winter wheat, (b) other crops, (c) forests, (d) built-up areas and (e) water at different growth stages of winter wheat.
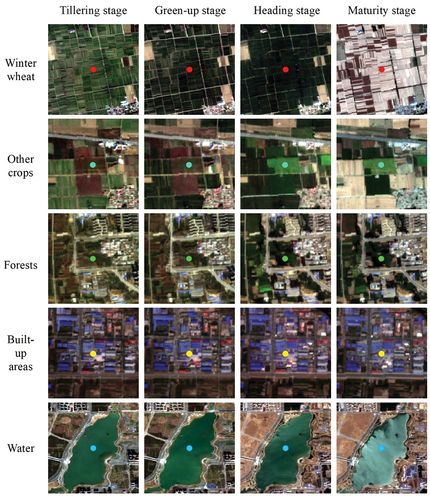
Figure 3. Time series EVI and standard error bars for winter wheat, other crops, forests, built-up areas, and water.
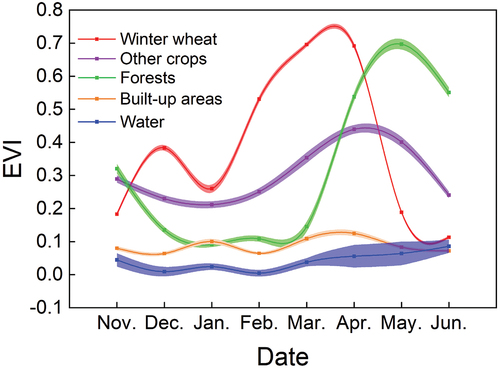
Table 2. Independent t test between winter wheat and nonwinter wheat in terms of the mean values of the phenological features using 50 samples for each class.
Figure 4. Box plots of the WWMI of winter wheat, other crops, forests, built-up areas and water samples in Zhumadian.
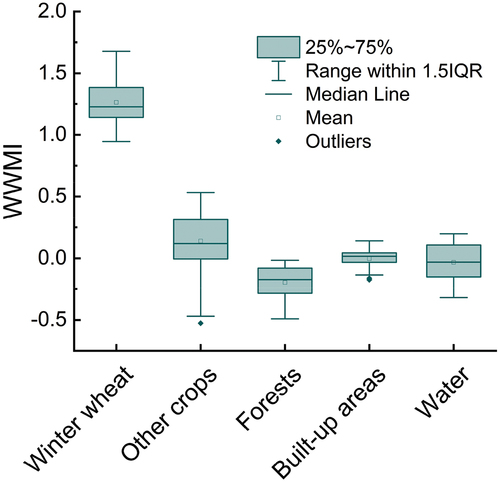
Figure 5. The (a) WWMI and (b) winter wheat map generated by the pixel-based WWMI in Zhumadian.
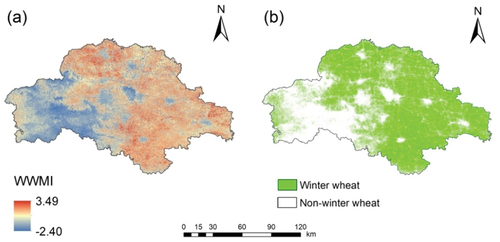
Figure 6. County-level comparisons between the official statistical data and the WWMI-derived winter wheat areas by the (a-b) empirical threshold, (c) Otsu, and (d) Kapur methods in Zhumadian. (a), (c) and (d) show the pixel-based results, and (b) shows the object-oriented results.
Figure 7. Subsets of the (a) true color composite of the Sentinel-2 image acquired on 12 April 2020, and (b) WWMI image and winter wheat map achieved by the (c) pixel-based WWMI and (d) object-oriented WWMI in 2020. Sites A, B, C and D show salt-and-pepper noise in (c), and site E shows unidentified field footpaths in (d).
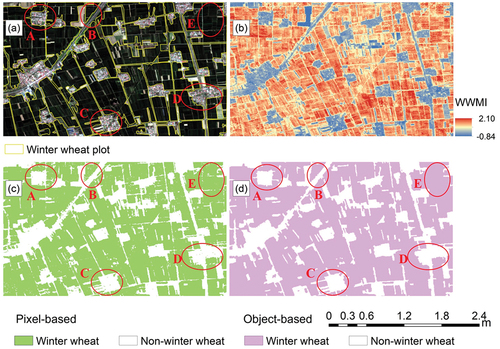
Figure 8. The (a) WWMI image and (b) winter wheat map generated using the WWMI in Henan Province for 2020.
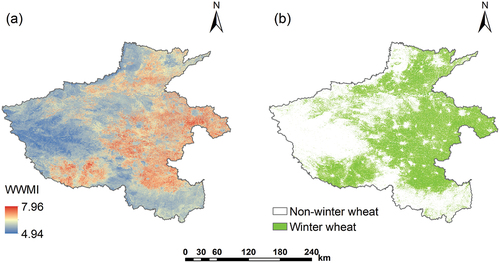
Figure 9. Comparisons of the official statistics and the WWMI-derived wheat areas in 2020 achieved by the (a-b) empirical threshold and (c-d) Otsu methods. (a) and (c) show the results at the municipal level. (b) and (d) show the results at the county level.
Table 3. The REs between the official statistics and the WWMI-derived wheat areas at the municipal level achieved by the empirical threshold and Otsu methods.
Table 4. Confusion matrix of winter wheat mapping results in 2020.
Figure 10. Comparisons of the official statistical data and the WWMI-derived wheat areas in 2019 achieved by the Otsu method at (a) the municipal and (b) the county levels.
Figure 11. County-level comparisons between the official statistical data and the WWI-derived wheat areas in Zhumadian in 2020.
Data availability statement
The sample data that support the findings of this study is available at https://code.earthengine.google.com/69125eaba8bfba5facb27928bbe1f0b0. The official statistics are available on Henan Province Service of Statistics (http://tjj.henan.gov.cn/).