
Figures & data
Figure 1. Image of black marble VNP46A2 in the study area of Beijing. Beijing is the region for modelling research, and three cities including Xi’an, Shanghai, and New York are selected as verification test areas.
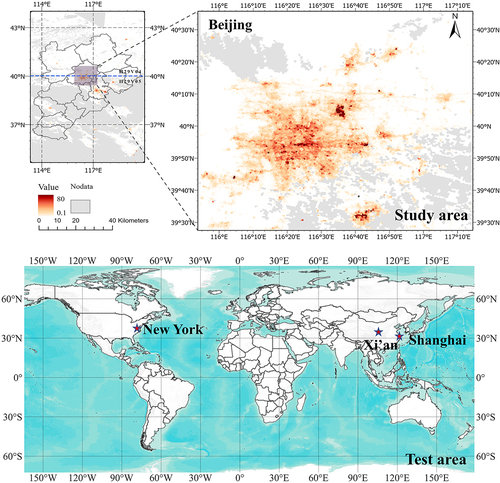
Figure 2. Overview of the missing data fraction of VNP46A2 data in 2017 in the study area.
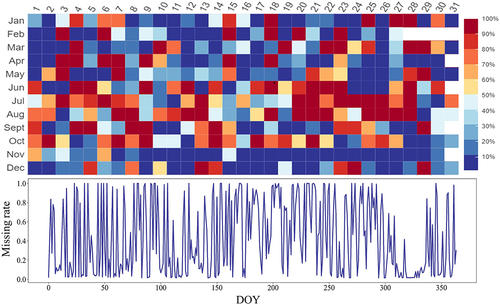
Figure 3. The overall flowchart of the NTL gap-filling method.
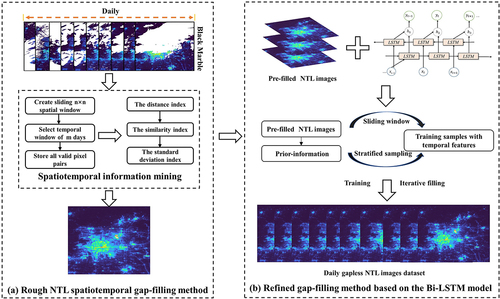
Figure 4. The framework for rough NTL spatiotemporal gap-filling method.
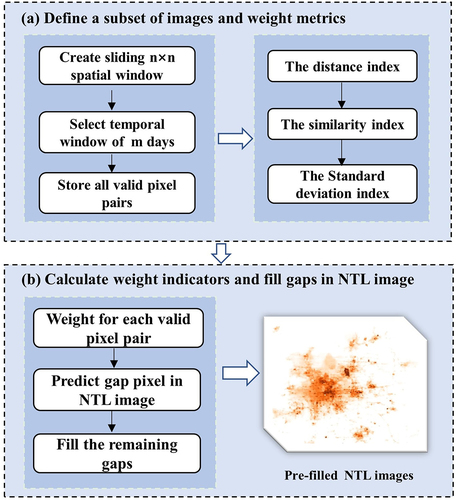
Figure 5. Spatial diagram for interpreting formula variables.
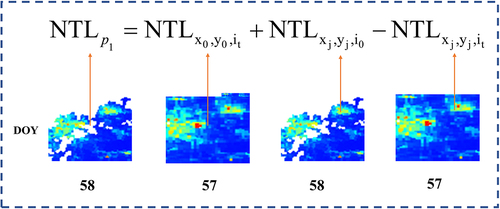
Figure 6. The framework for the refined gap-filling method based on the Bi-LSTM model.
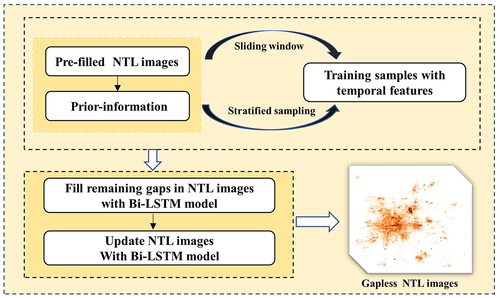
Figure 7. External and internal structures of the Bi-LSTM neural network. (a) LSTM cell structure; (b) the whole structure of the Bi-LSTM neural network.
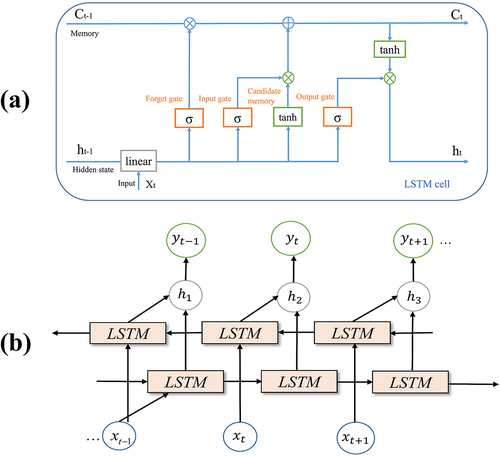
Figure 8. Evaluation of temporal length in Bi-LSTM model in study area of Beijing. The upper and bottom curves represent R2 and RMSE, respectively.
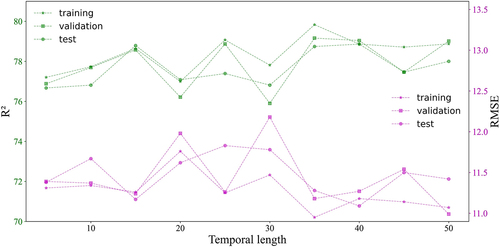
Figure 9. Comparison of the gap-filling effect before and after NTL data reconstruction in the research area. The blank in the original image shows the missing areas, and 57, 121, 212, 305 represents the day of year (DOY).
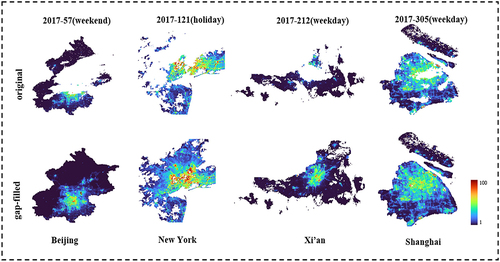
Figure 10. A comparison of our result with existing product gap filled BRDF corrected DNB NTL is analyzed spatially and temporally in three typical urban functional areas of Shanghai: the residential area, the commercial area, and the airport. The blue curve represents our gap-filling results, and the red curve represents gap filled BRDF corrected DNB values.
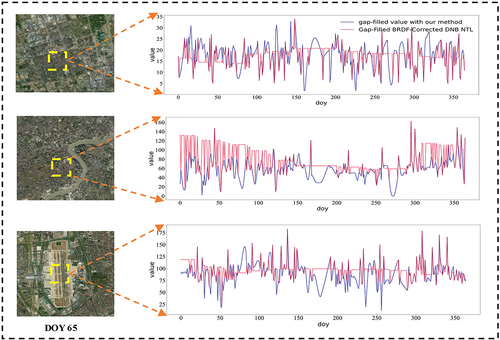
Figure 11. The gap-filling results for temporal analysis in iconic city locations: (a) Beijing Capital International airport, (b) Beijing Business District, and (c) Olympic Park. The images on the left represent the high-resolution satellite image in the target area. The plots on the right represent the time series of NTL pixels after gap-filling in the target locations in 2017. The blue curve represents the actual NTL pixel time series values, and the red curve represents the gap-filled NTL pixel time series values for the missing observations.
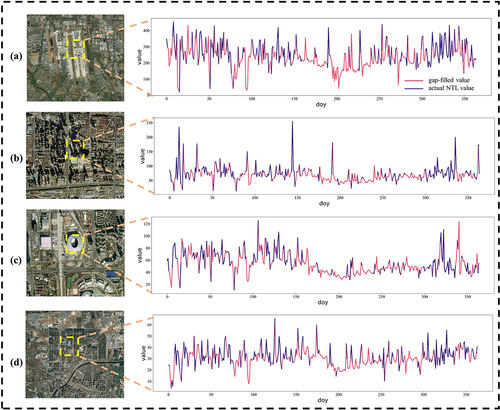
Figure 12. Accuracy comparison of the gap-filled NTL data using the proposed gap-filling method ranging from 10% to 50% missing rates. The black frame represents artificially created gaps in the original NTL data, (a) represents the observed NTL image, (b) represents the gap-filled NTL image, and (c) represents the corresponding scatterplot and accuracy evaluation. N represents the total number of pixels participating in the scatterplot evaluation.
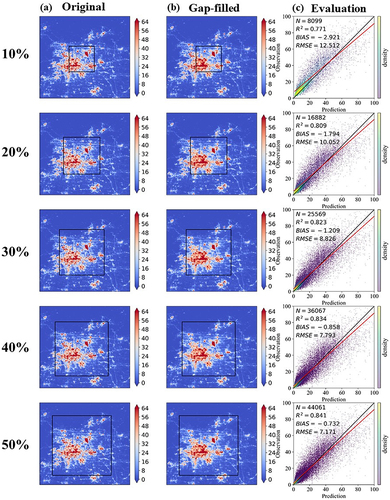
Figure 13. Comparison of the accuracy of the gap-filling method proposed in this paper with the STARFM method. Four cities, Beijing, Shanghai, Xi’an and New York, were selected for comparison and verification. The blank in the original image shows the missing areas, and 205,47,103,38 represents the day of year (DOY).
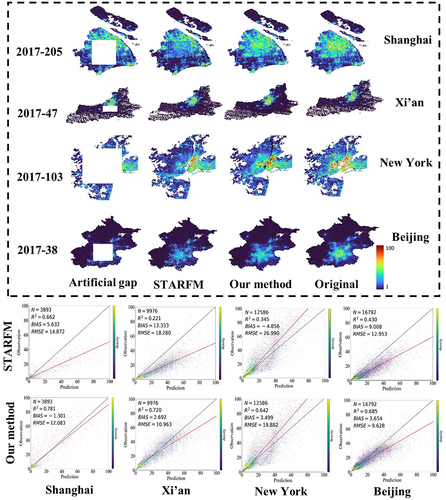
Table 1. Evaluation of gap-filling accuracy based on the Bi-LSTM model at different missing lengths in study area of Beijing.
Figure 14. Comparison of the gap-filled NTL value and actual NTL value, and rows (a) to (d) represent four specific sample points, indicating the gap-filling results by the model at different missing lengths in study area of Beijing.
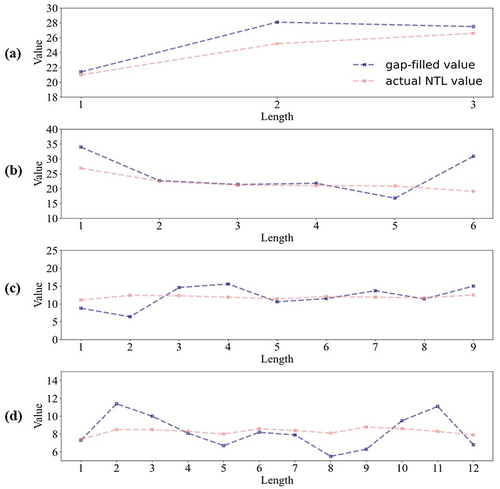
Figure 15. Accuracy comparison of the gap-filled NTL data using between the rough NTL spatiotemporal gap-filling method and refined gap-filling method based on the Bi-LSTM model ranging from 10% to 50% missing rates.
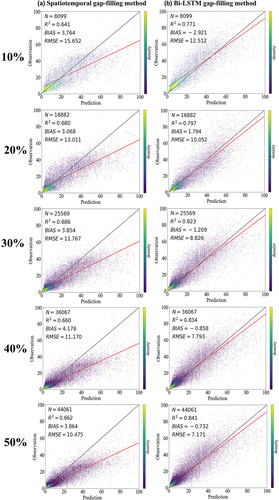
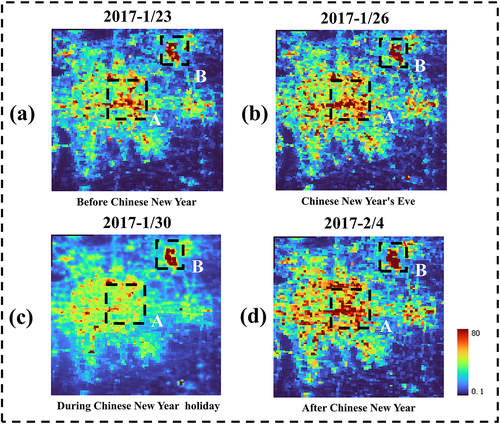
Figure 16. The impact of the short-term migration of a huge population during the Chinese New Year holiday on NTL images. Site A and B correspond to the areas of Beijing Capital International airport and Beijing Business District, respectively.
Data availability statement
The data that support the findings of this study are available upon request by contact with the corresponding author, or accessed through https://earthexplorer.usgs.gov.