
Figures & data
Figure 1. (a) Map of the VMD illustrating the distribution and density of BC, district names, and an inset map displaying the location of operational, under construction, and planned dams. The Tien and Hau sections, corresponding to the bathymetry survey, are outlined by a gray dotted rectangle. The green square dot signifies Can Tho’s discharge station (Q), while the blue background indicates the water body. (b) Seasonal discharge and water level (2014–2022) at the Can Tho. (c) Photograph showing a significant bank collapse in an SM zone. (d) Photograph of a BC used for sand extraction from the riverbed. S. Kumar took both pictures during a field survey near Long Xuyen City on the Hau River on 27th June 2022.
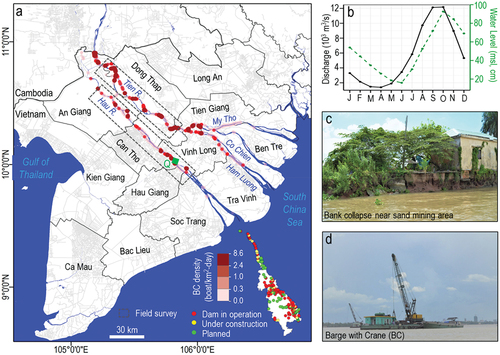
Table 1. Examples of the different boat types – BC, STB, and other – were identified from different sources: ground observations, Google Earth images, PlanetScope, and Sentinel-1. Ground observations and Google Earth images were pivotal in identifying boats within PlanetScope, facilitating the classification of boats in Sentinel-1. After identification in Sentinel-1, 1,364 boats were labeled as BC, 1,901 as STB, and 8,073 as other for developing training datasets.
Table 2. Summary of metrics used in this research for evaluating the DL model performance.
Figure 2. The comprehensive methodological framework developed and utilized in this study.
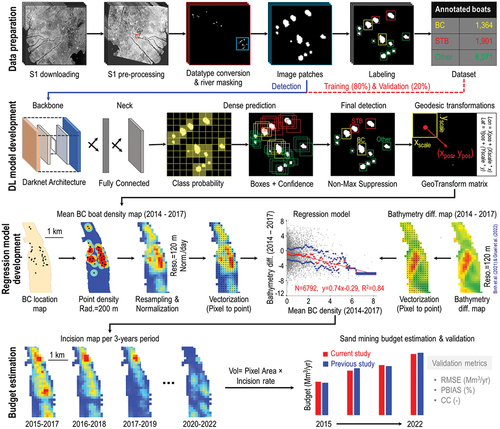
Figure 3. Deep Learning model performance evaluation. (a) Evolution of box, objectness, and classification loss functions of DL during the training and validation. The metrics presented in the graph enable a comparative analysis of the differences in learning curves during the training and validation. (b) A comparative analysis of model efficacy based on four evaluation metrics during training for three different batch sizes (16, 25, and 32). (c) Confusion matrix: illustrates the model’s performance trained with a batch of 16 on the validation dataset. (d) Precision-Recall curve: depicts the precision and recall trade-off for the DL model under the same training conditions (batch size 16).
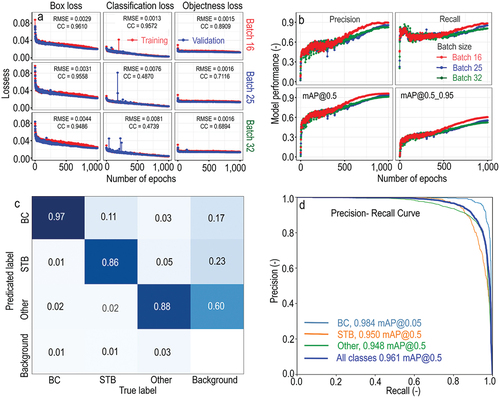
Figure 4. Spatiotemporal dynamics and density of BC boats in the VMD (2014–2022): (a) Trends of BC, STB, and other boats over nine years. (b) Seasonal fluctuations in SM activities. (c) Average BC density map in the VMD from 2014 to 2022, created with a 200 m buffer at a 120 m resolution. (d,e) High BC density areas. (f-i). Tracing the evolution of zones exhibiting different boat densities over the nine years (2014–2022).
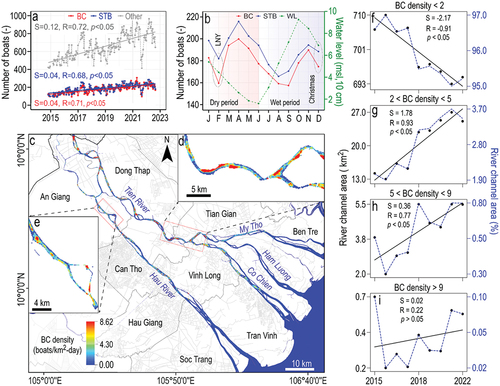
Figure 5. Spatial regression model between bathymetry differences and BC density along the Tien Section from 2014–2017. (a,d,f) BC density (boats/km2-day). (b,c,e) Change in bathymetry throughout the same period. (g) A spatial correlation plot of BC density versus bathymetry difference at a 120 m resolution. Blue points correspond to the first Q1 and third Q3 quartiles, while the red point signifies the median of the bathymetry difference computed at each 0.1 increment of BC density.
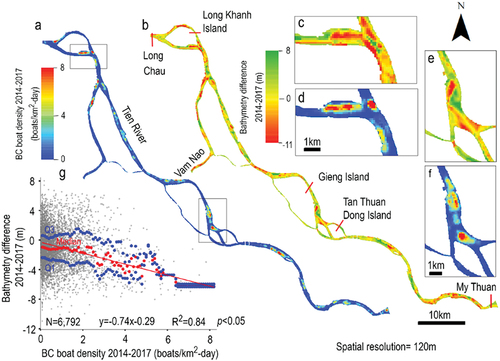
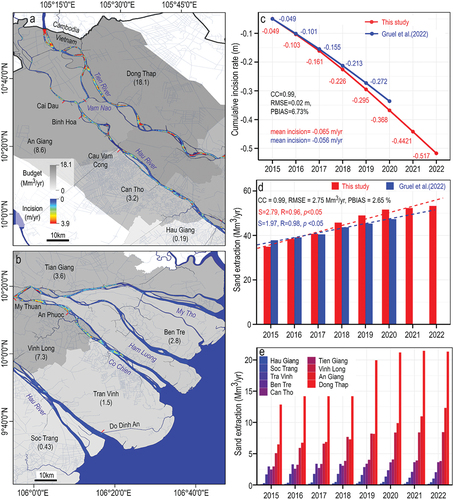
Figure 6. Sand volume extraction and riverbed incision rates. (a,b) Average incision rate across the VMD, with the provincial scatter and the average SM budget per district represented in varying shades of gray. (c) Comparison of the cumulative incision over the same period, paired with a statistical analysis in relation to prior research. (d) Comparison of the annual total extracted sand volume for the VMD with previous research, inclusive of statistical metrics and trend analysis. (e) Annual distribution of SM extraction across various districts within the VMD.
Supplementary_materials_Revised.docx
Download MS Word (1.7 MB)Data availability statement
The datasets generated and analyzed during the current study can be requested by the corresponding author.