
Figures & data
Figure 1. Study area.
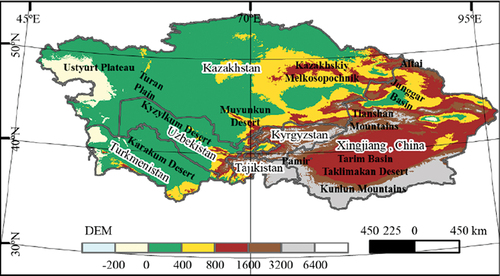
Table 1. Summary of the datasets used in the analysis.
Table 2. Classification of NDVI, LAI and soil moisture trends.
Figure 2. Spatial distribution of turning years: NDVI (a), LAI (b), soil moisture (c), and the columnar diagram of the area proportion of each turning year (d). Blank areas indicate no turning year (P > 0.05).
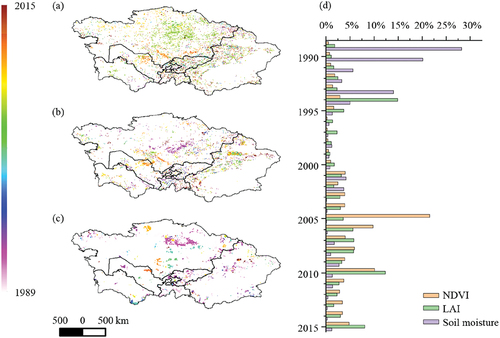
Figure 3. Spatial distribution of the trend classes for NDVI (a), LAI (b) and soil moisture (c) from 1985 to 2020 in Central Asia.
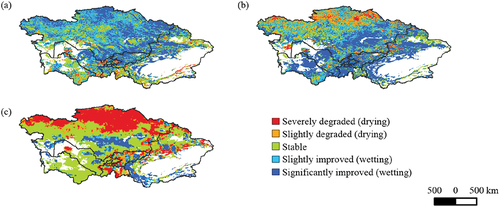
Figure 4. Partial correlation coefficients (Rp) between soil moisture and the following variables: (a) NDVI (removing the effects of precipitation and temperature), (b) precipitation (removing the effects of NDVI and temperature), (c) temperature (removing the effects of NDVI and precipitation), (e) LAI (removing the effects of precipitation and temperature), (f) precipitation (removing the effects of LAI and temperature), and (g) temperature (removing the effects of LAI and precipitation). Blank areas indicate partial correlations that failed the significance test (P > 0.05). The distribution and proportions of the area occupied by the controlling factors: (d) NDVI, precipitation and temperature; and (h) LAI, precipitation and temperature. Blank areas indicate NDVI < 0.1 or LAI ≤ 0 in Central Asia during the growing seasons.
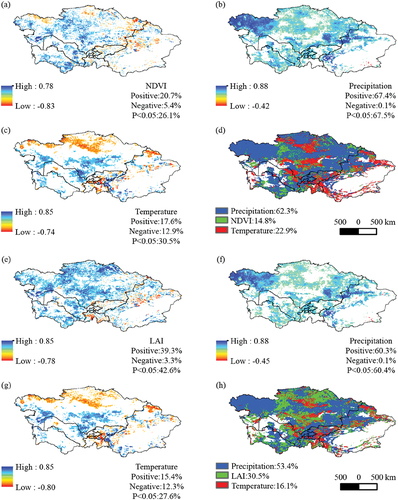
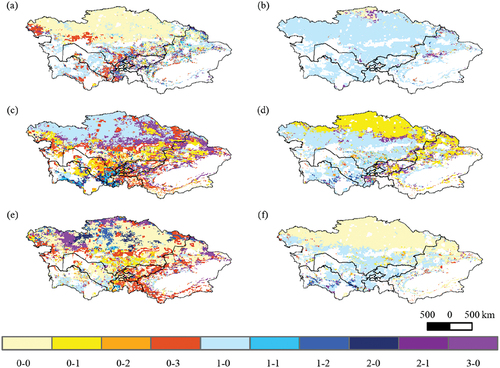
Figure 5. The time (lag-accumulation) effects of soil moisture in combination with different factors: effects of soil moisture in combination with different factors: (a) NDVI, (b) LAI, (c) precipitation (with NDVI as the vegetation index), (d) precipitation (with LAI as the vegetation index), (e) temperature (with NDVI as the vegetation index), and (f) temperature (with LAI as the vegetation index).
Appendix_A_TF.docx
Download MS Word (3.2 MB)Data availability statement
The data that support the findings of this study are available from the corresponding author upon reasonable request.