
Figures & data
Figure 1. Distribution of the 19 NEON sites and their corresponding forest types across the CONUS. Italic numbers represent the number of eco-climate domains which correspond to the IDs in table S1 in supplementary.
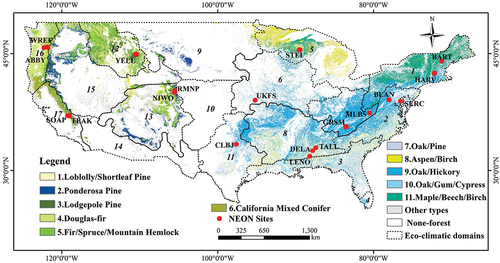
Table 1. Geographic location and environmental characteristics of the NEON sites.
Table 2. Summary of screening strategies for GEDI L2A.
Table 3. Five raster AGBD products.
Table 4. Categories and data sources of the selected nine factors.
Figure 2. Flowchart of methodology of GEDI L4A accuracy evaluation and uncertainty estimation.
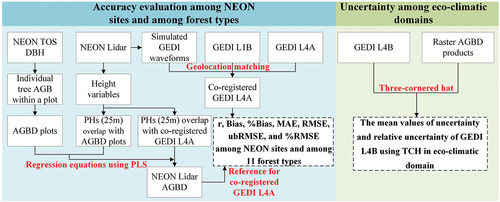
Table 5. Accuracy of NEON lidar AGBD for the different NEON sites.
Figure 3. Comparison of GEDI L4A’s accuracy among NEON sites. Data points in scatter plots represents GEDI footprints.
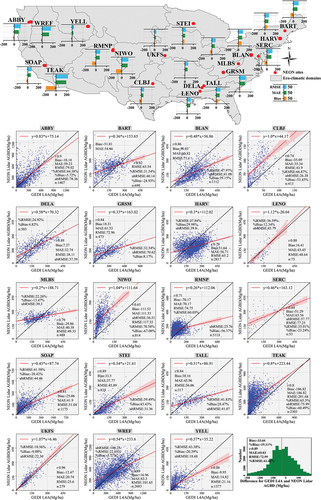
Figure 4. Comparison of GEDI L4A’s accuracy among forest types. The number of each forest type corresponds to the one in . Data point in the scatter plots represents GEDI footprints.
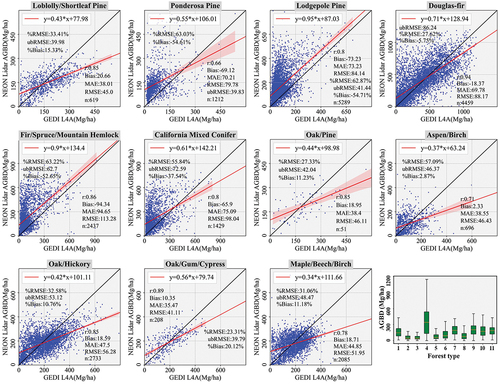
Figure 5. Spatial distribution of GEDI L4B’s uncertainty and relative uncertainty.
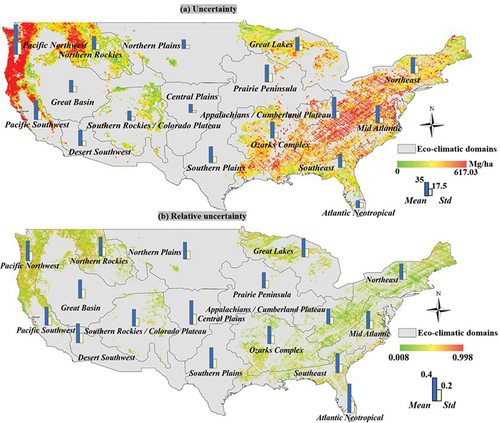
Table 6. Statistics of GEDI L4B’s uncertainty and relative uncertainty.
Figure 6. Relationship between different effect factors and the AD of GEDI L4A. Δ|Bias| represents the maximum difference of the mean value of each group.
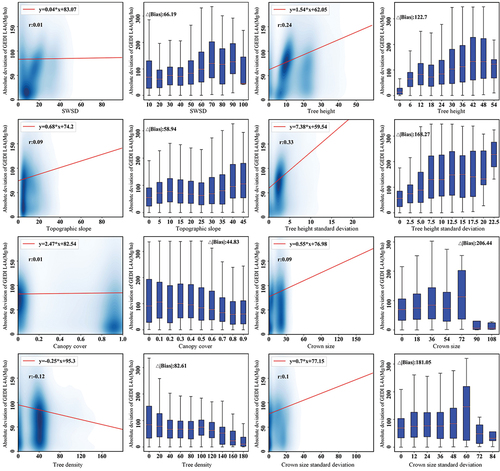
Table 7. Relative importance of factors to the AD of GEDI L4A.
Figure 7. Structural equation model between the AD of GEDI L4A and multiple factors with significant correlation.
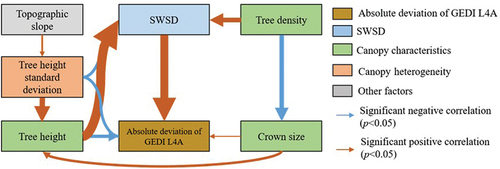
Table 8. Relative importance of factors to SWSD.
Figure 8. Comparison of the spatial distribution of GEDI L4B with 5 other AGBD products.
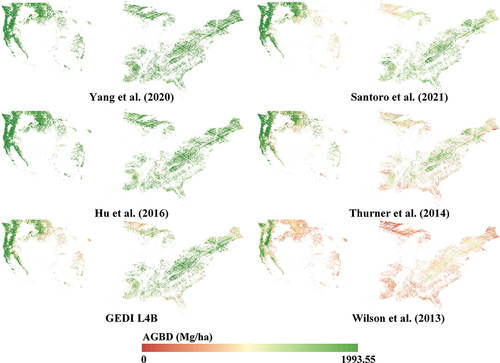
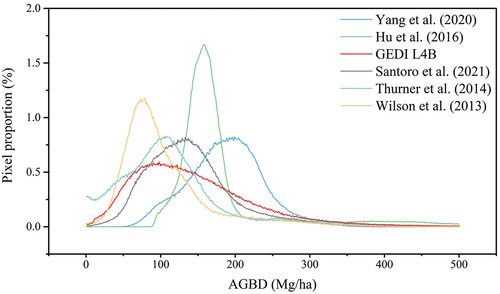
Figure 9. Comparison of a statistical histogram of GEDI L4B with other 5 AGBD products across the CONUS.
supplementary1107.docx
Download MS Word (1.6 MB)Data availability statement
The raw discrete point cloud LiDAR and GEDI data were generated at the National Ecological Observation Network (NEON) and the Land Processes Distributed Active Archive Center (LP DAAC), respectively. Derived data supporting the findings of this study are available from the corresponding author on request.