
Figures & data
Figure 1. Overview of the Yangtze River Basin. (a) Is the map of the annual average temperature distribution in the Yangtze River Basin. (b) Is the digital elevation model (DEM) distribution map of the Yangtze River Basin. (c) Is the land use and cover (Yang and Huang Citation2021) type map of the Yangtze River Basin.
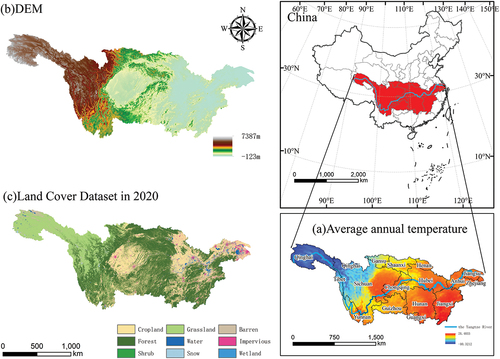
Figure 2. The spatial distribution characteristics of average vegetation carbon use efficiency in the Yangtze River Basin from 2005 to 2020.
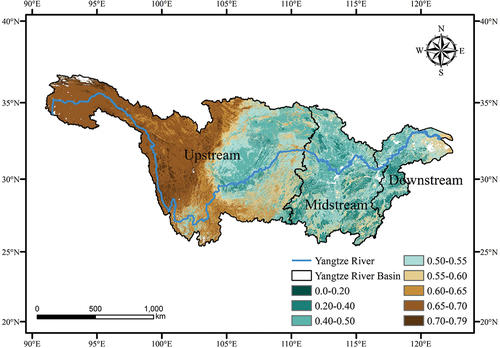
Figure 3. The distribution of vegetation carbon use efficiency changes in the Yangtze River Basin from 2005 to 2020.
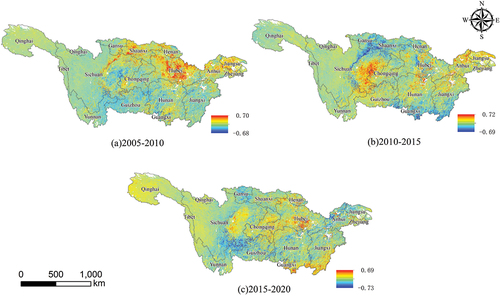
Figure 4. The spatiotemporal pattern of vegetation carbon use efficiency in the Yangtze River Basin. (a) Presents the trend significance results obtained using the Theil-Sen and Mann-Kendall methods. (b) Shows the Hurst index results. (c) Depicts the future trend of CUE.
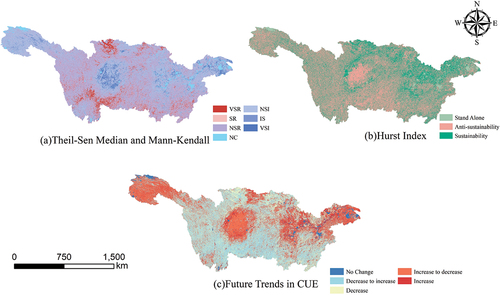
Figure 5. The vegetation carbon utilization rate results for typical months in the Yangtze River Basin in 2020. (a) Is for January (winter). (b) Is for April (spring). (c) Is for July (summer). (d) Is for October (autumn).
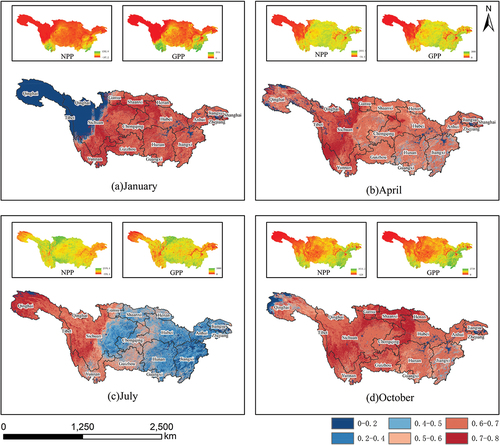
Figure 6. The monthly vegetation carbon utilization rate results for the Yangtze River Basin in 2020.
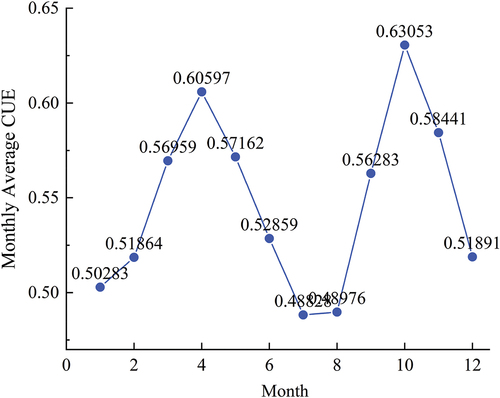
Figure 7. The annual average vegetation carbon use efficiency from 2005 to 2020 in the Yangtze River Basin.
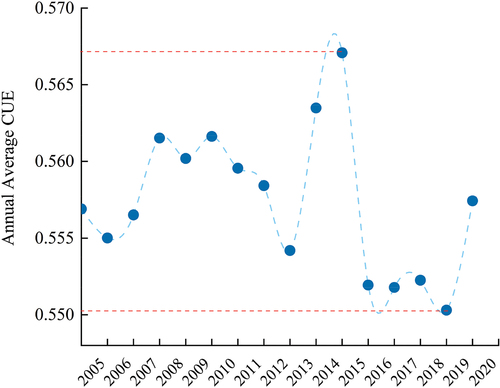
Figure 8. The vegetation carbon utilization rates in different ecosystem types within the Yangtze River Basin.
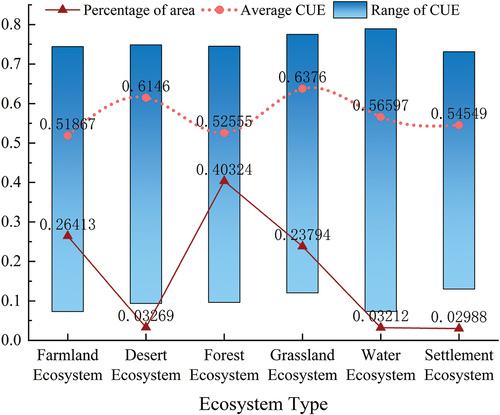
Figure 9. Secondary land use vegetation carbon use efficiency. (a) Represents the average value and range of CUE. (b) Shows the annual average precipitation for that land use type.
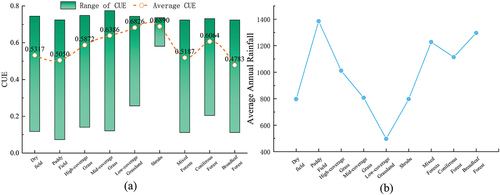
Figure 10. Variations in the impact of climate factors on vegetation carbon use efficiency. (a) Represents temperature factors. (b) Represents precipitation factors.
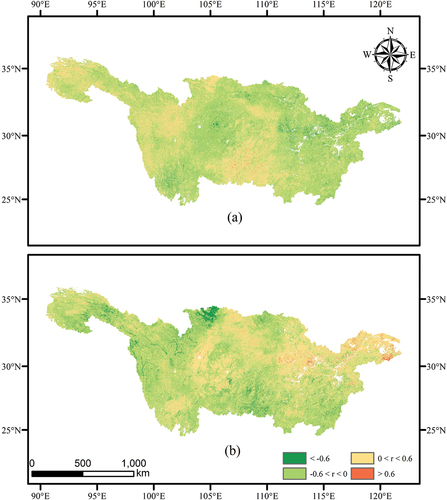
Table 1. Number of ecological sources and corridors.
Figure 11. The ecological network of vegetation carbon utilization efficiency in the Yangtze River Basin from 2005 to 2020.
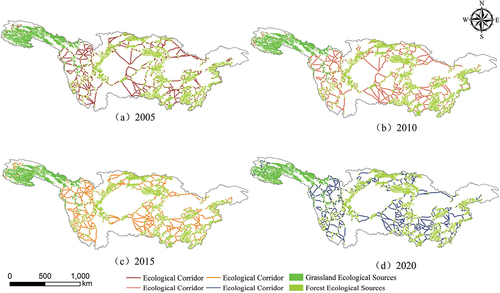
Figure 12. The topological properties of the ecological network in the Yangtze River Basin. (a) Degree. (b) Betweenness centrality. (c) Clustering. (d) Eigenvector centrality. (e) Closeness centrality.
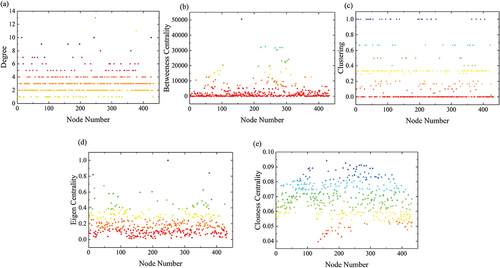
Figure 13. The correlation between topological indicators and vegetation carbon utilization efficiency. Asterisks indicate statistical significance: **p < 0.01.
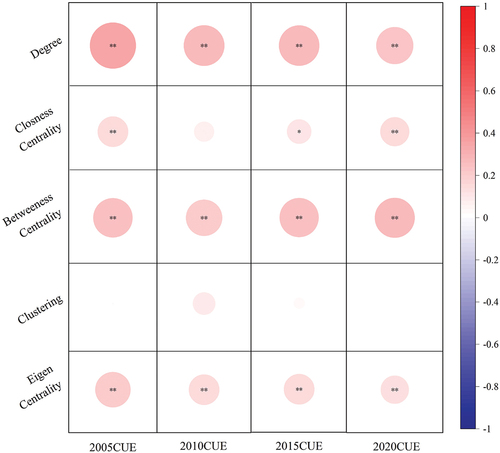
Figure 14. The changes in average vegetation carbon utilization efficiency in ecological source areas from 2005 to 2020.
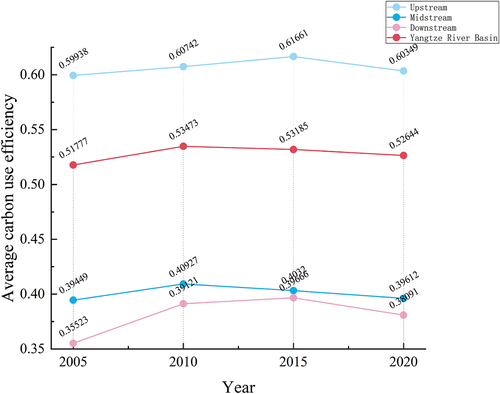
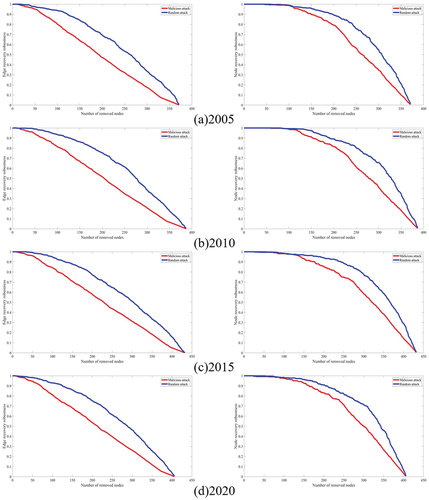
Figure 15. The changes in edge recovery robustness and node recovery robustness of the ecological network of vegetation carbon utilization efficiency in the Yangtze River Basin from 2005 to 2020 under malicious and random attacks.
Data availability statement
The data that supported the findings of this study were obtained from publicly available datasets, and the websites providing access to these datasets were included in the article.