
Figures & data
Figure 1. Location of Umbria in Italy (red polygon in the inset). The study area is shown in Landsat 8 composite infrared together with the boundaries of the Umbria region and the OCM Landscape layer in the background. White rectangles indicate the locations of the areas chosen to show the classification results in detail.
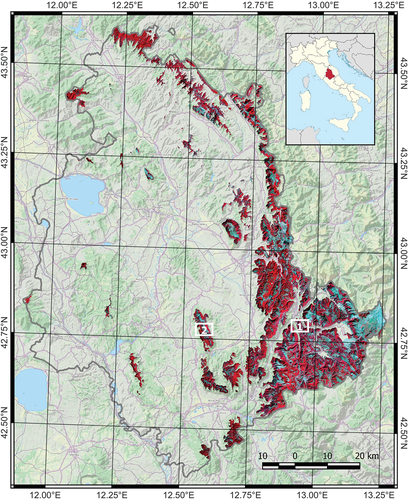
Figure 2. Methodological workflow of the research.
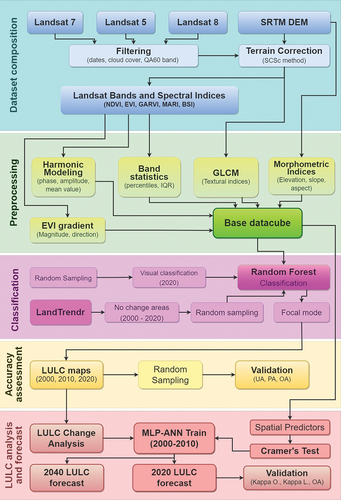
Table 1. Selected LULC classes, codes, and descriptions.
Table 2. Spectral indices and related formulas.
Table 3. Textural indices calculated using GLCM (gray-level Co-occurrence matrix).
Table 4. Bands and indices calculated for the composition of the base datacube.
Figure 3. Distribution of the importance scores of the variables used in the RF classification for (a) 2000, (b) 2010, and (c) 2020.
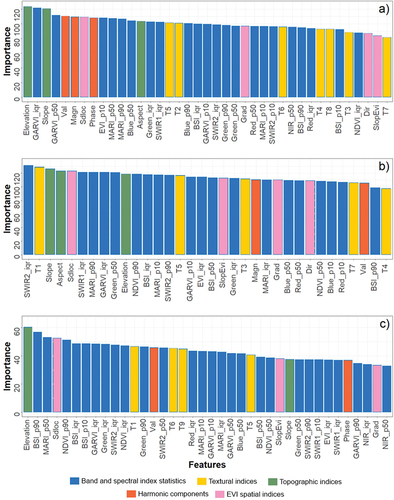
Table 5. Accuracy metrics of LULC classifications for each year (UA: User’s Accuracy; PA: Producer’s accuracy).
Figure 4. Sankey’s diagram showing the main transition flows (greater than 5 km2) between the five land-cover classes in the study area between 2000–2010, 2010–2020 and 2020–2040.
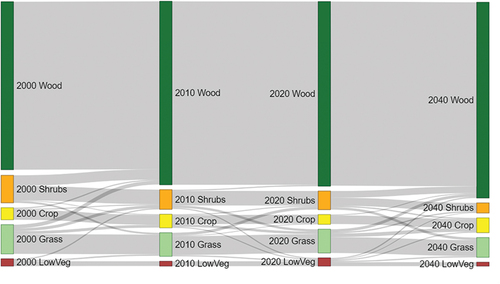
Figure 5. Land cover maps of 2000, 2010, 2020, and 2040 in two exemplifying areas. The scale and the north sign are indicated in the final image of both areas. The full maps, and a comparison with orthophoto and a global land cover product are provided in the supplementary materials.
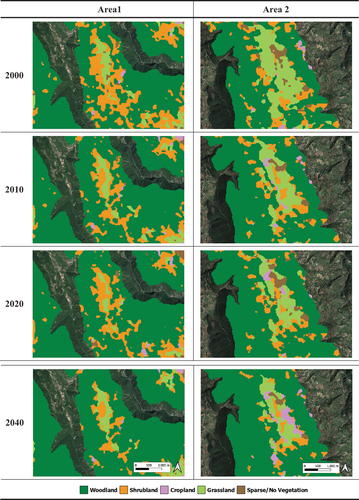
Table 6. Area of land cover classes (km2) in three different years (2000, 2010, 2020) and the increase/decrease percentage over 20 years (2000–2020) for the entire study area and the Natura2000 sites. The potential area of land cover classes (km2) and percentage of increase/decrease are also shown for the 2040 forecast.
R2_Supplementary_Materials_clean.docx
Download MS Word (15.2 MB)Data availability statement
All remote sensing data used in the research are openly available in the USGS archives (https://earthexplorer.usgs.gov/) and within Google Earth Engine. The GEE codes developed in this research are available by emailing the authors upon any reasonable request.