
Figures & data
Figure 1. Location of the study area.
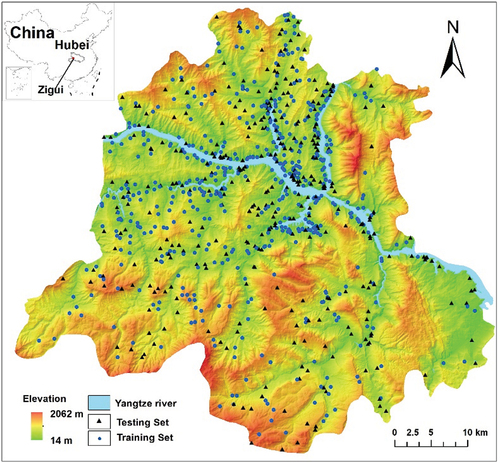
Figure 2. Landslide condition factor maps excluding elevation factor; the elevation factor map is shown in . The legends of the lithology map: (1) water (2) loose soil (3) soft clay (4) soft and hard sandstone–claystone lithofacies (5) moderately hard to weakly soft conglomerate–sandstone lithofacies (6) hard thick-bedded sandstones (7) weakly karstified carbonates (8) moderately karstified carbonate (9) medium-strength karstified carbonate (10) strongly karstified carbonates (11) hard lava rocks (12) hard metamorphic rocks.
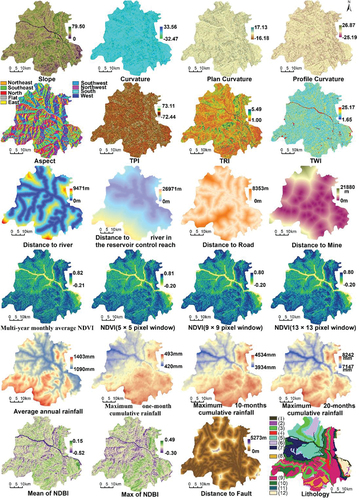
Table 1. The description and data source of landslide condition factors used in this study.
Table 2. The causes of selecting the landslide condition factors used in this study.
Figure 3. Detailed procedure of the PU-pullbaggingDT method.
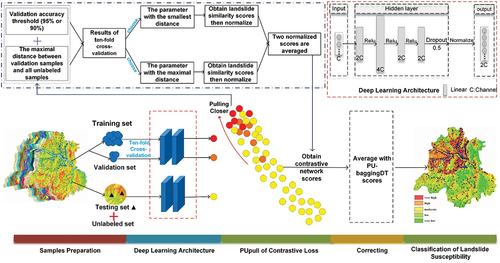
Figure 4. Landslide susceptibility map of the study area: (a) PU-pullbaggingDT_valid47 (b) PU-pullbaggingDT_valid50 (c) PU-pullbaggingDT_valid52 (d) PU-baggingDT (e) AdaPU-RF.
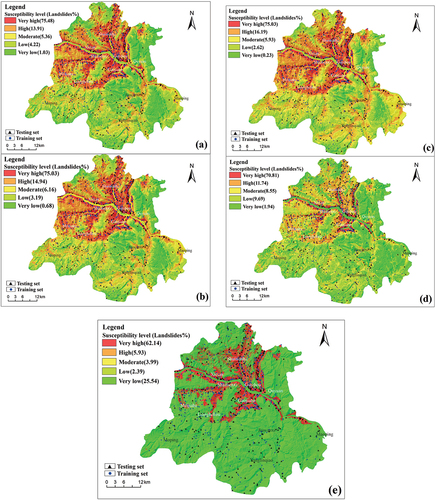
Table 3. Accuracy results of different models for the PU dataset in Zigui county. The range [×-×] refers to cells whose output scores fall within this range. “PCT” is an abbreviation for percentage, and “PCT of cells” refers to the cells within the score range [×-×] that occupy a percentage of all cells within Zigui county. Test_R_PA refers to the percentage of correct predictions in the testing set within the score range [×-×]. valid47, valid50, and valid52 refer to the selected validation accuracy threshold of 47/52, 50/52, and 52/52, respectively.
Figure 5. (a) The loss of D-TNN in different stage. (b) The Test_PA of D-TNN at the 30th/50th/70th epoch of stage 2. (c) The Test_Left_AUC of D-TNN at the 30th/50th/70th epoch of stage 2. (d) The Test_Right_AUC of D-TNN at the 30th/50th/70th epoch of stage 2.
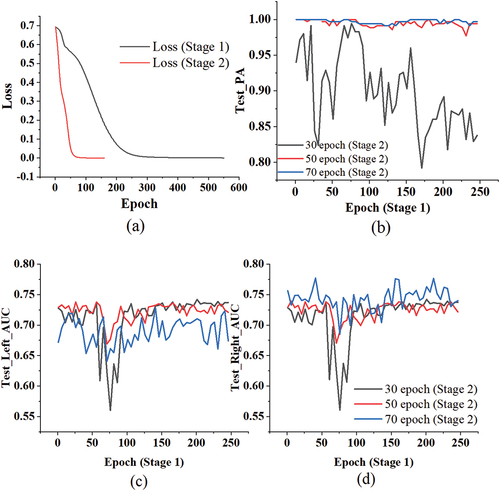
Figure 6. The probabilistic classification results of all cells within Zigui county at the 30th/50th/70th epoch of stage 2 for D-TNN.
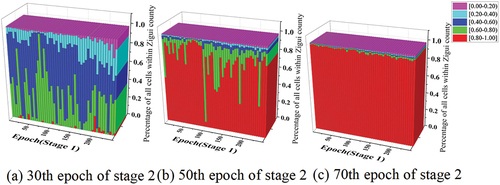
Table 4. Accuracy results of different models for the PU dataset in Zigui county. Test_Right_AUC and Test_left_AUC refer to the AUC results based on the testing set.
Figure 7. The Right_AUC results of contrastive network for testing set were calibrated by PU-baggingDT.
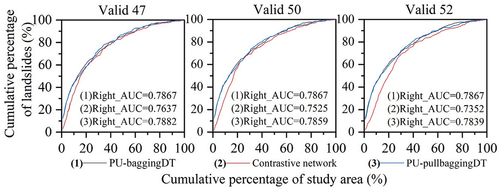
Figure 8. The low accuracy results of PU-baggingDT for the testing set were calibrated using the contrastive network.
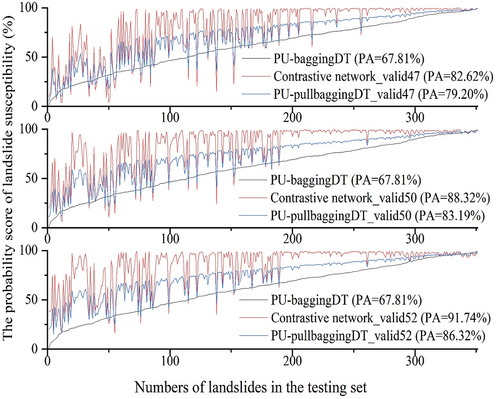
Figure 9. Impact of different validation accuracies on the accuracies of the contrastive network for the testing set.
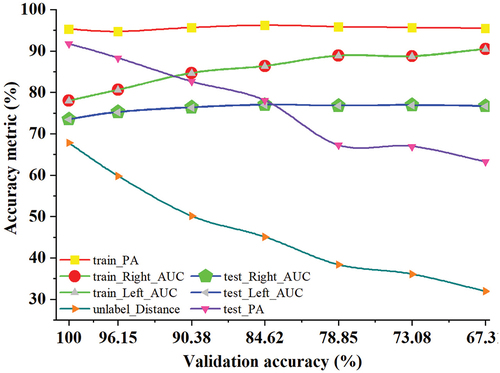
Figure 10. Feature importance ranking of 25 conditioning factors, the abbreviations for the names are listed in .
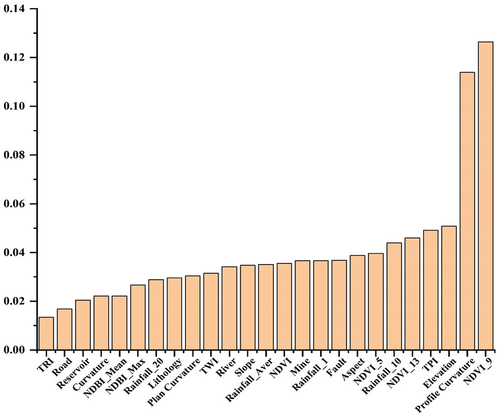
Figure 11. Spearman correlation coefficient of 25 conditioning factors, the abbreviations for the names are listed in .
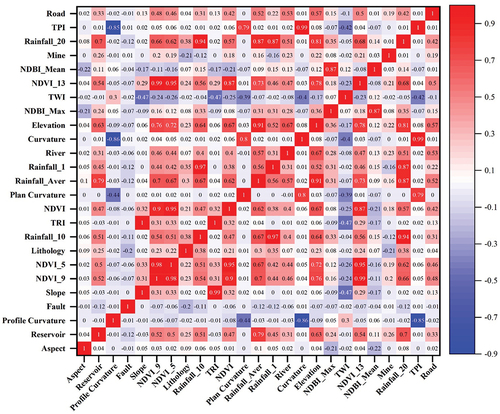
Table 5. Accuracy results of different models for the remaining 12 factors.
Figure 12. Sampling positions of five randomly selected negative samples.
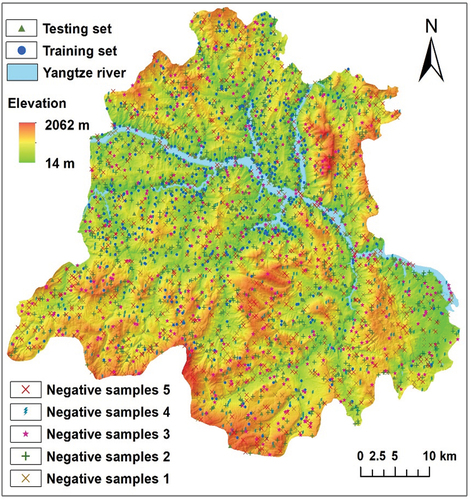
Table 6. Accuracy results of various machine learning models on five randomly selected negative samples.
Data availability statement
We present the codes openly available at https://github.com/ShubingOuyangcug/PU-pullbaggingDT to encourage reproducibility of the study.