
Figures & data
Figure 1. SAR image effects by layover, foreshortening, and shadowing.
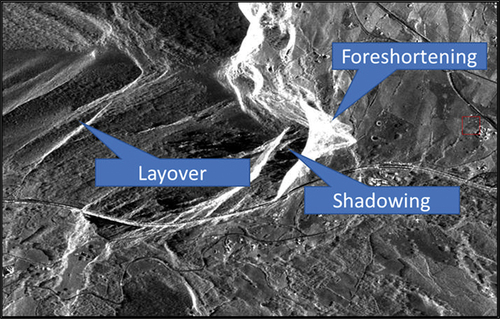
Figure 2. True and LOS displacement components, modified from Duro et al. (Citation2013).
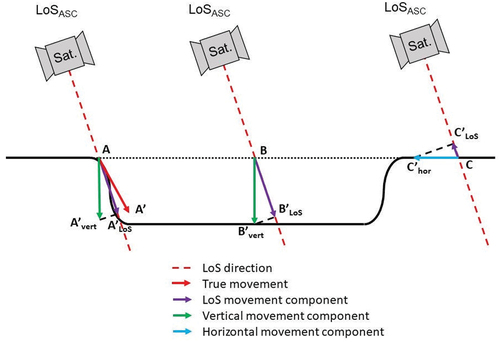
Figure 3. COSMO-SkyMed strips. The upper four are the ascending stripes, and the bottom four are the descending stripes. The abbreviations H4–01, H4–03, H4–04, and H4–05 are the original ones used by ASI.
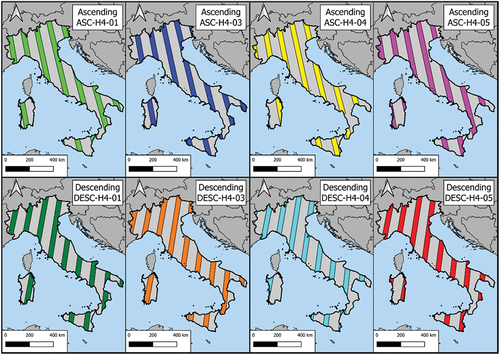
Table 1. Incident angle, expressed in degrees, for the different himage centre.
Figure 4. R-Index maps (full page maps in annex A): ascending (left), descending (right).
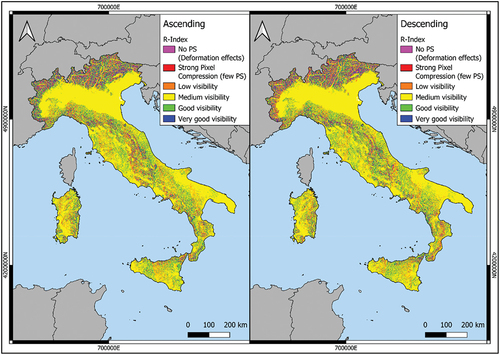
Figure 5. Percentage of measurability of movement maps (full page maps in annex a): ascending (left), descending (right).
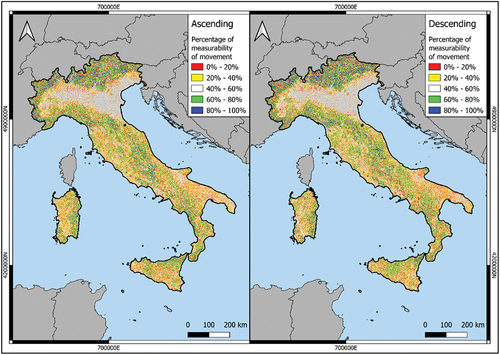
Figure 6. R-index sketch maps: a) Italy map; b and c) Ascending; d and e) descending.
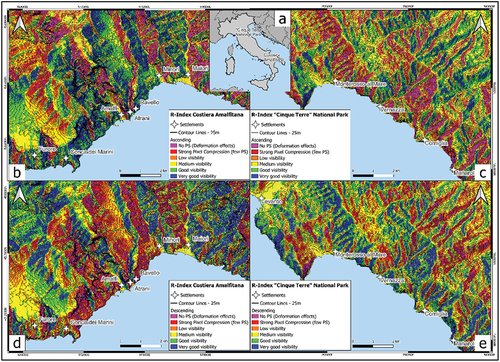
Table 2. Spatial extent of different classes of R-indexes.
Figure 7. a) descending PSs detected in the area of Punta Campanella (https://gn.mase.gov.it/), Campania Region, and b) R-Index map for the descending geometry of the same area.
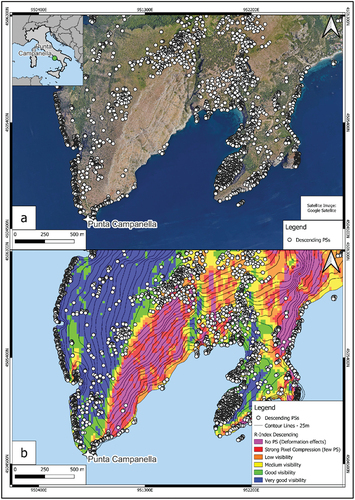
Figure 8. Percentage of measurability of movement sketch maps: a) Italy map; b and c) Ascending; d and e) descending.
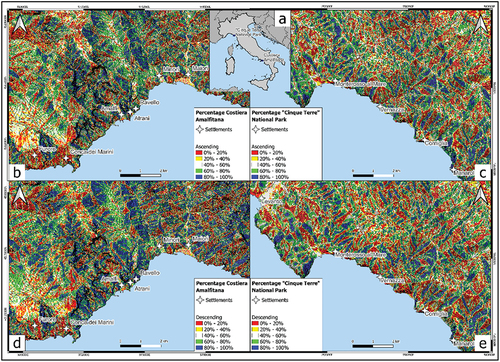
Table 3. Spatial extent of different classes of percentage of measurability of movement.
Figure 9. Mean displacement rate and percentage of measurability of movement maps in ascending (a and b) and descending (c and d) orbits. Interferometric data have been obtained from (https://gn.mase.gov.it/) and landslide boundary from (Fusco et al. Citation2023).
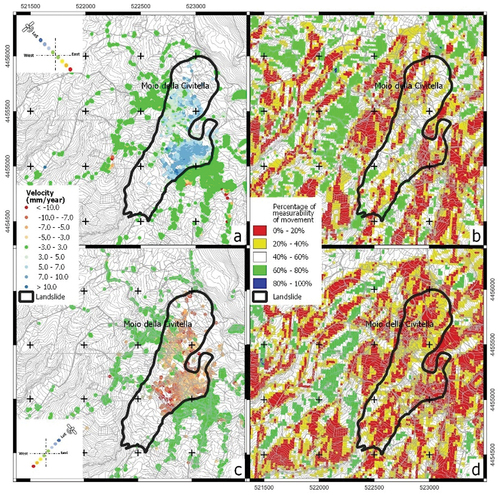
Table A1. Ascending R-Index data for the single strips.
Figure A1. R-Index map of the Italian Peninsula, ascending geometry.
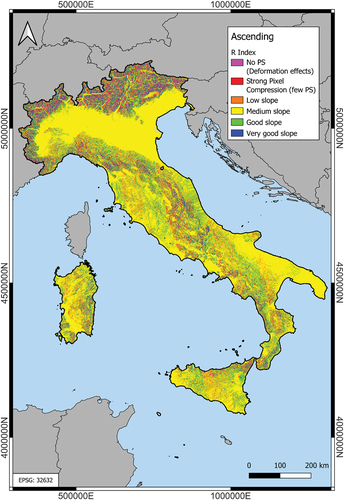
Table A2. Descending R-Index data for the single strips.
Figure A2. R-Index map of the Italian Peninsula, descending geometry.

Table A3. Ascending percent of measurability of movement data for the single strips.
Figure A3. Percentage of measurability map of the Italian Peninsula, ascending geometry.
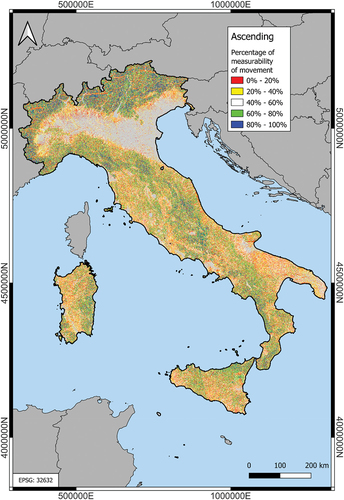
Table A4. Descending percent of measurability of movement data for the single strips.
Figure A4. Percentage of measurability map of the Italian Peninsula, descending geometry.

Figure A5. Weighted average visibility score for the ascending tracks of H4_01.
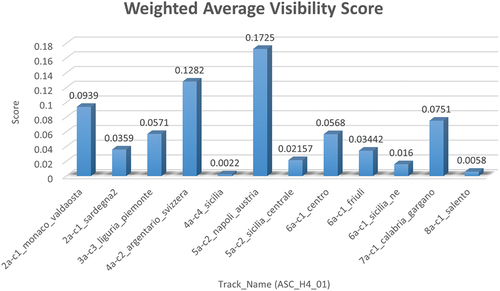
Figure A6. Weighted average visibility score for the ascending tracks of H4_03.
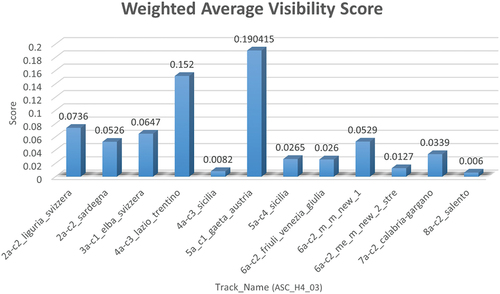
Figure A7. Weighted average visibility score for the ascending tracks of H4_04.
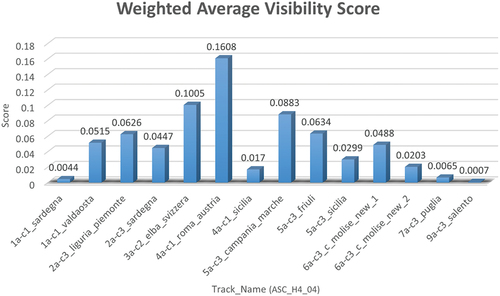
Figure A8. Weighted average visibility score for the ascending tracks of H4_05.
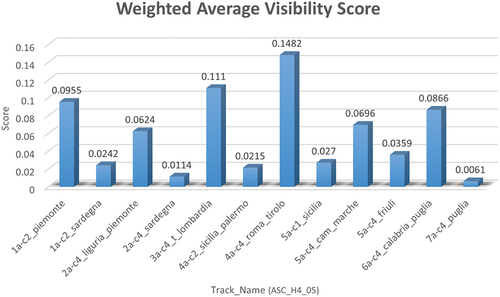
Figure A9. Weighted average visibility score for the descending tracks of H4_01.
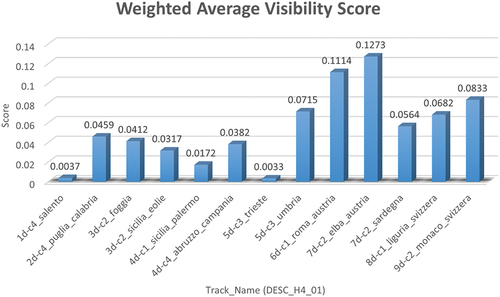
Figure A10. Weighted average visibility score for the descending tracks of H4_03.
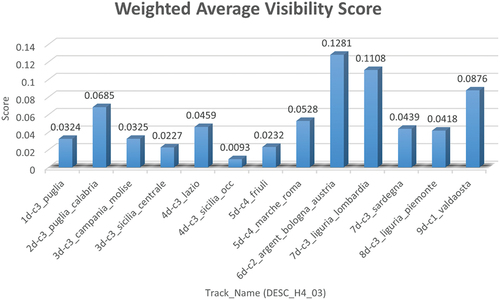
Figure A11. Weighted average visibility score for the descending tracks of H4_04.
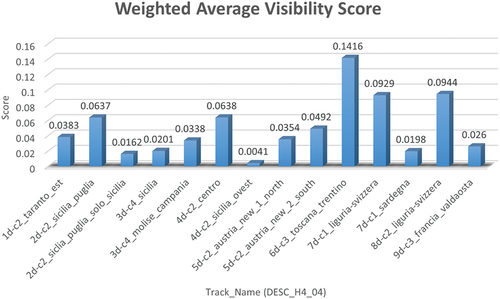
Figure A12. Weighted average visibility score for the descending tracks of H4_05.
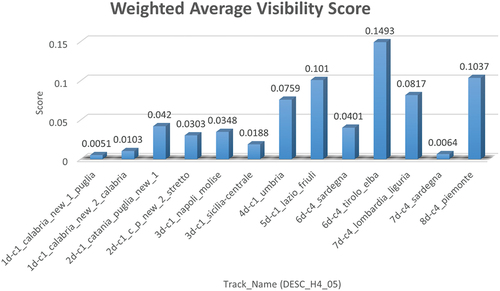
Figure B1. R-Index Model for ascending geometries.
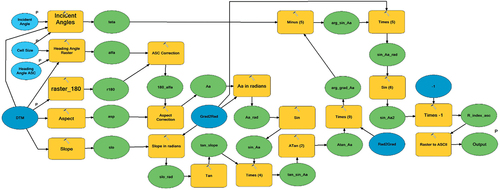
Table B1. Input and main intermediate parameters for the R-Index model in ascending geometry.
Figure B2. R-Index Model for descending geometries.
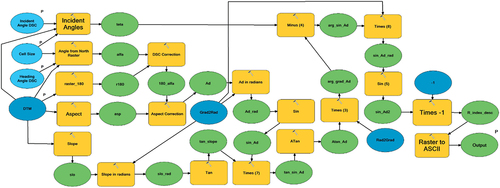
Table B2. Input and main intermediate parameters for the R-Index model in ascending geometry.
Figure B3. Percentage of movement measurability Model for ascending geometries.
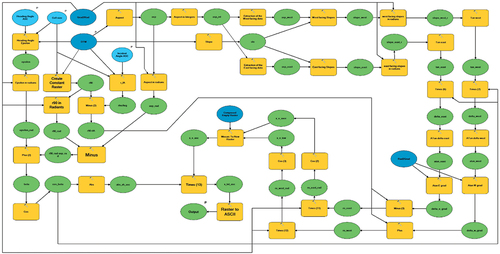
Table B3. Input and main intermediate parameters for the percentage of movement measurability model in ascending geometry.
Figure B4. Percentage of movement Model for descending geometries.
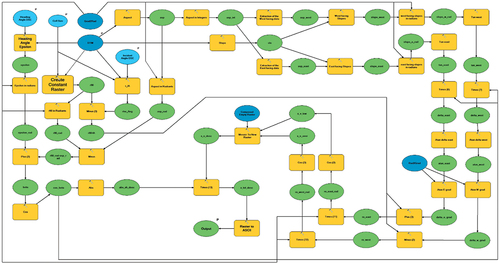
Table B4. Input and main intermediate parameters for the percentage of movement measurability model in ascending geometry.
Data availability statement
Data repository structure: The atlas geodatabase will be available in a repository. It is intended to make it open and available to all researchers and professional users. Data generated in this work will be accessible from the repository in which a single packaged zip archive will be uploaded. It will contain a “READ_ME” text file that will provide guidance information for users and two subfolders: “R-Index” and “Percentage.”
All features are projected in the WGS 84/UTM zone 33 N coordinate system.
The majority of the work was carried out by ArcMap 10.5, but all items were produced in a format importable into any other GIS software.