
Figures & data
Figure 1. Geographical location and land cover types of the YRB.
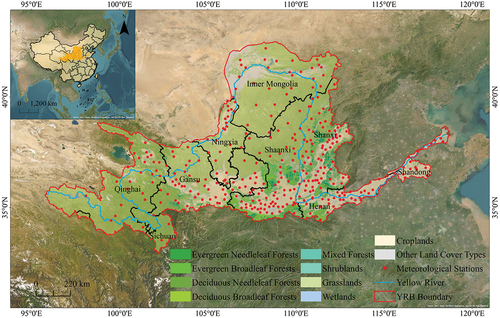
Table 1. The data sources in this study.
Figure 2. Research framework for structural and functional optimizations between ecological spatial network and vegetation CUE.
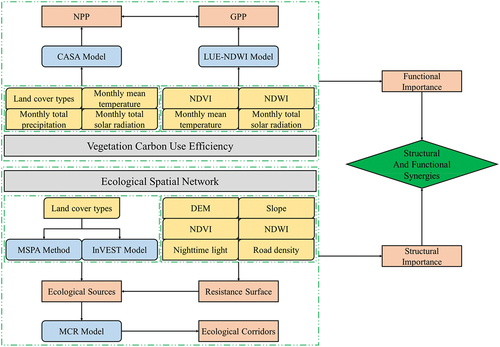
Table 2. The resistance factor evaluation system of the YRB.
Figure 3. Calculation results of NPP by CASA model (left) and its linear regression analysis with available MODIS data (right).
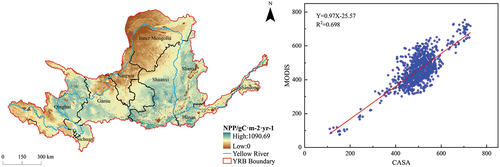
Figure 4. Calculation results of GPP by LUE-NDWI model (left) and its linear regression analysis with available MODIS data (right).
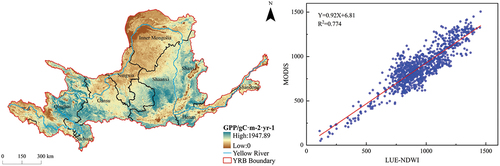
Figure 5. Calculation results of vegetation CUE according to NPP and GPP.
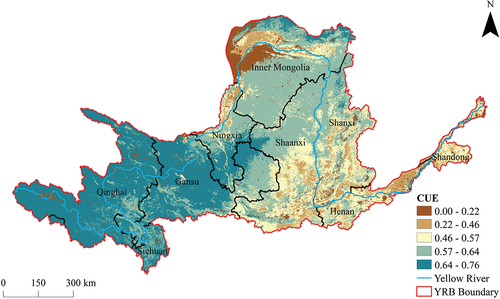
Figure 6. Ecological sources (a) and ecological resistance surfaces (b) in the YRB.
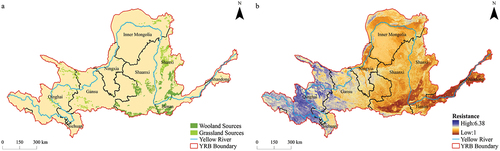
Figure 7. Woodland-shrubland-grassland ecological spatial network in the YRB.
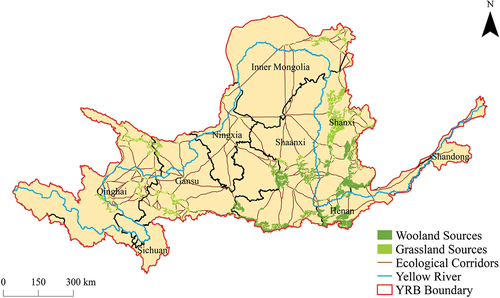
Figure 8. Topological properties of nodes including degree centrality (a), closeness centrality (b), and eigenvector centrality (c) in the ecological spatial network.
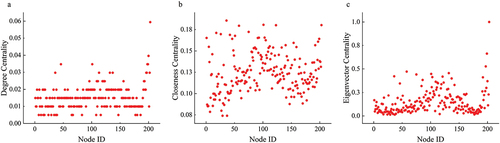
Figure 9. Community division of ecological sources in the YRB.
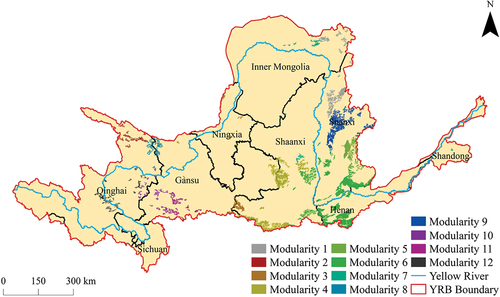
Figure 10. Pearson’s correlation coefficients matrix between vegetation CUE and topological properties of all nodes (a), woodland nodes (b), and grassland nodes (c).
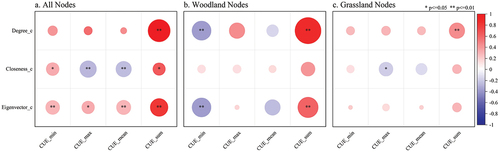
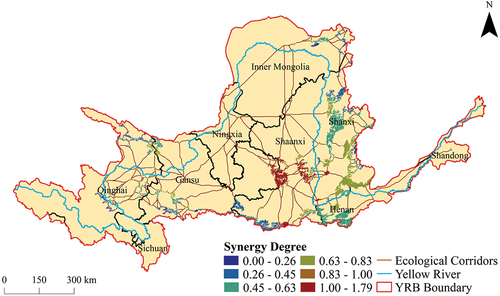
Figure 11. Structural-functional synergy degree in the ecological spatial network.
Data availability statement
The data that supported the findings of this study were obtained from publicly available datasets, and the websites providing access to these datasets were included in the article.