
Figures & data
Figure 1. Images of five test sites. (a) Yantai, China (175 km2); (b) Xuancheng, China (1185 km2); (c): Rancho Viejo, Mexico (397 km2); (d) Ochiltree, USA (547 km2); and (e) Gibson, Australia (298 km2).
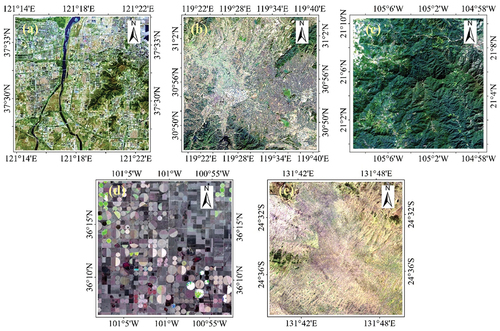
Table 1. Image pairs used for the study.
Table 2. Statistics of the first-level per-band comparison.
Figure 2. Percentage stacked bar chart illustrating the trends of average PC and R2 as wavelength increases and a mutually inverse relationship between the two metrics.
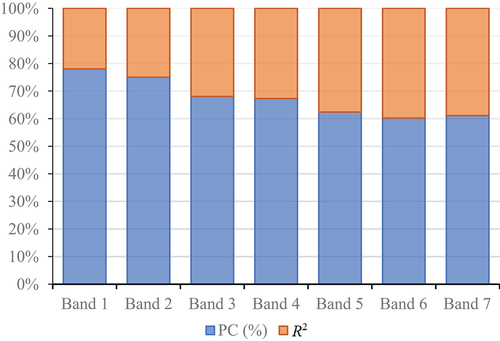
Table 3. Statistics of the second- and third-level comparisons.
Figure 3. Indicator-based comparisons between Landsat-8 (L8) and Landsat-9 (L9) over the five test sites, with scatter plots of L9 vs. L8 (first row of each site), the density scatter plots of bias (L9 – L8) as a function of Landsat-9 indicator values (second row of each site), and the histograms of the differencing images (L9 – L8) (third row of each site).
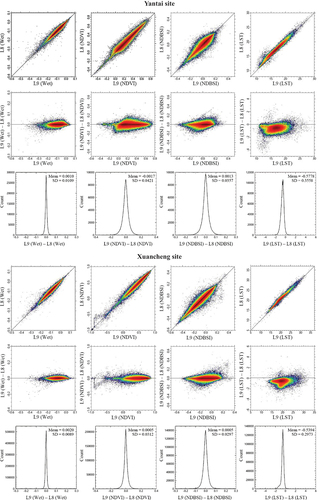
Figure 3. (Continued).
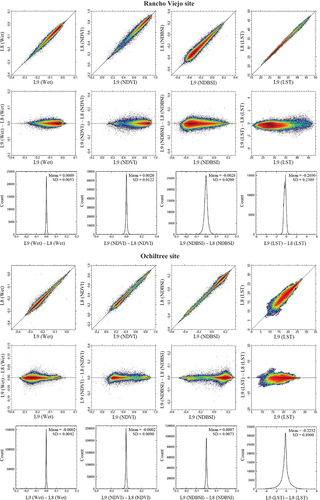
Figure 3. (Continued).
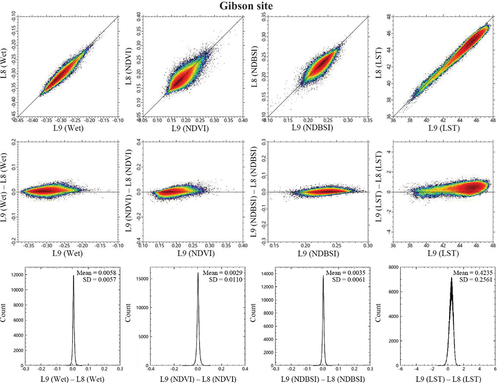
Figure 4. Composite index (RSEI)-based comparison between Landsat-8 and Landsat-9 over the five test sites, with original true-color images (left of the first row of each site), RSEI image pairs (center and right of the first row of each site), scatter plots of L9 vs. L8 (left of the second row of each site), scatter plots of bias (L9 – L8) as a function of Landsat-9 values (center of the second row of each site), and histograms of the differencing images (L9 – L8) (right of the second row of each site).
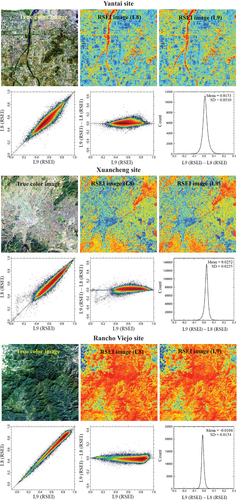
Figure 4. (Continued).
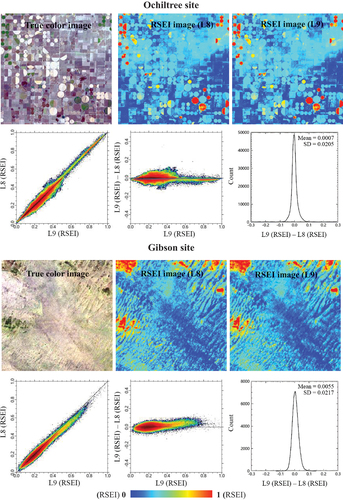
Table 4. Statistics of three-level comparisons.
Table 5. Statistics of the six land cover types averaged across the five sites.
Figure 5. Dynamic data range of each band of Landsat-8 and −9 averaged from the five test sites.
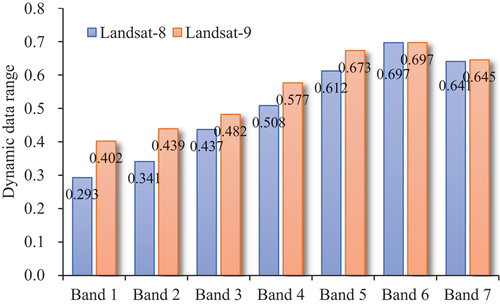
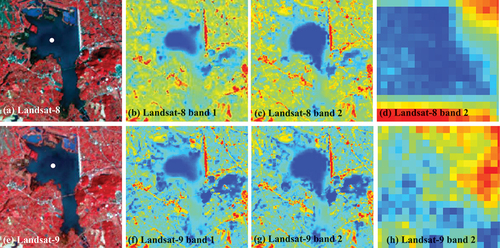
Figure 6. Images of a lake in the Xuancheng site, highlighting the radiometric solution difference in identifying dark water areas between Landsat-8 and −9. (a) and (e): Landsat-8 and −9 false-color images (RGB: bands 5, 4, 3); (b) and (c): Pseudo-color images of Landsat-8’s bands 1 and 2; (f) and (g): Pseudo-color images of Landsat-9’s bands 1 and 2; (d) and (h): Pseudo-color images with a zoomed-in view of the white dot in ).
Data availability statement
The remote sensing image data utilized in this study can be obtained from the United States Geological Survey website (https://earthexplorer.usgs.gov). The other data are available from the corresponding author upon request.