
Figures & data
Figure 1. The color composite images (FP SAR VV (red), VH (green), and HH (blue)) of the backscattering coefficients of FP SAR data (a: July 27, 2012; b: September 16, 2015).
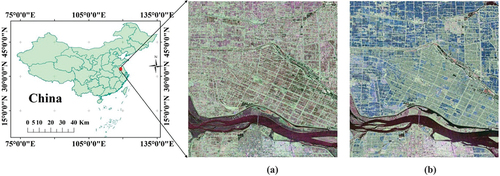
Figure 2. The color composite images of Pauli decomposition of FP SAR data (a, b, c, and d are SAR images of regions a, b, c, and d of study area 2 on March 6, 2017, respectively. e is SAR images of small region e on May 22, 2017. f is the distribution map of the five small regions in study area 2).
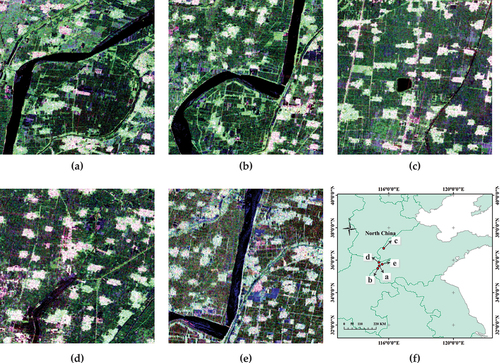
Figure 3. The color composite images of Pauli decomposition of FP SAR data (a: May 28, 2014; b: August 18, 2014; c: ground-truth data (blue, brown, red, green, and yellow plots are barley, corn, potato, sugar beet, and wheat, respectively).
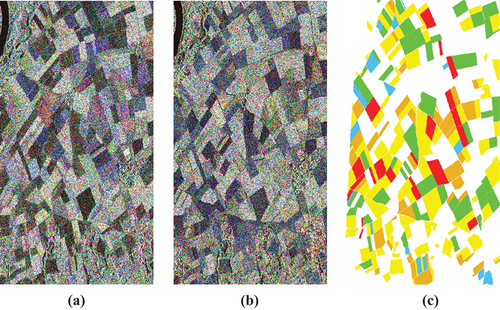
Table 1. Full-polarization SAR data parameters of multitemporal RADARSAT-2 C band data for study area 1.
Table 2. Full-polarization SAR data parameters of multitemporal GF-3 C band data for study area 2.
Table 3. Full-polarization SAR data parameters of multitemporal RADARSAT-2 C band data for study area 3.
Figure 4. Methodology flowchart.
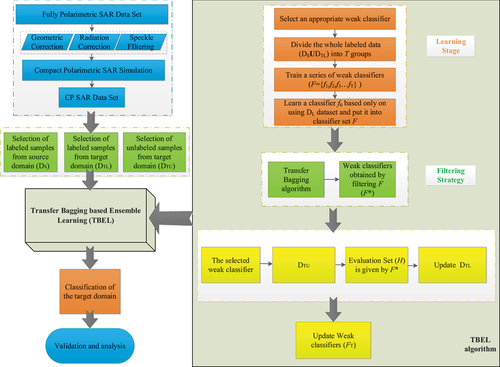
Table 4. Transfer experiments in study area 1.
Table 5. Transfer experiments in study area 2.
Table 6. Transfer experiments in study area 3.
Figure 5. Fine classification maps of two types of rice based on three transfer learning algorithms (TrBagg, BETL, and TBEL) in six groups of transfer experiments (a, b, c, d, e, and f are the transfer experiments in six groups of cross-year domains under the same phenological periods, and serial 1, 2, and 3 are the fine classifications of rice results based on the TrBagg, BETL, and TBEL algorithms, respectively). gt is the ground-truth area of five kinds of ground objects).
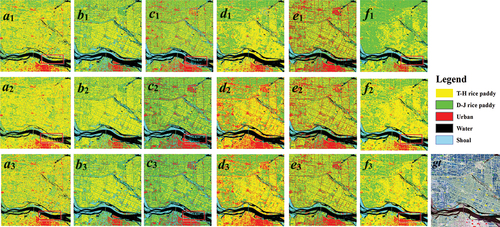
Figure 6. Fine classification maps of two types of rice based on three transfer learning algorithms (TrBagg, BETL, and TBEL) in three transfer experiments (g, h, and i are three groups of cross-year domains under different phenological periods).
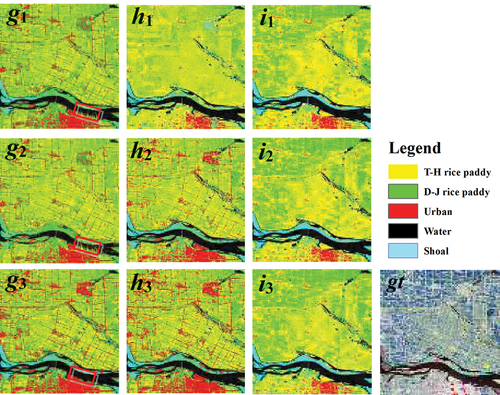
Table 7. Transfer learning-based method classification overall accuracy (OA) table with a decision tree as a weak classifier.
Table 8. Transfer learning-based method classification OA table with K-nearest neighbor classifier as a weak classifier.
Table 9. Transfer learning-based method classification OA table with random forest as a weak classifier.
Figure 7. The TBEL transfer learning-based method classification accuracy with different weak classifiers.
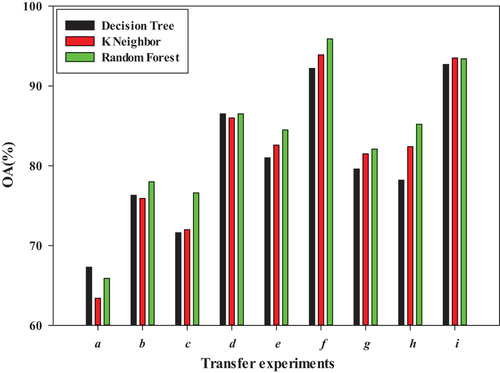
Figure 8. Classification maps of wheat based on the TrBagg, BETL, and TBEL algorithms under four groups of transfer experiments (a, b, and c are transfer experiments under the same phenological periods of similar scenes. d is the transfer experiment under different phenological periods of similar scenes, and serial 1, 2, and 3 are the classification results based on the TrBagg, BETL, and TBEL algorithms, respectively).
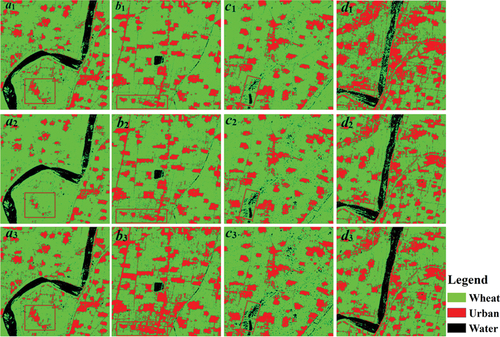
Table 10. Transfer learning-based method classification overall accuracy (OA) table with a decision tree as a weak classifier.
Table 11. Transfer learning-based method classification OA table with K-nearest neighbor classifier as a weak classifier.
Table 12. Transfer learning-based method classification OA table with random forest as a weak classifier.
Figure 9. The TBEL transfer learning-based method classification accuracy with different weak classifiers.
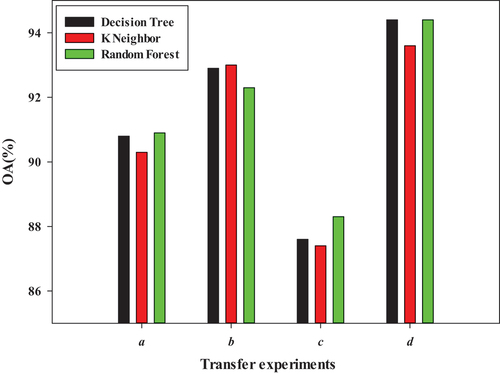
Figure 10. Fine classification maps of crops based on three transfer algorithms (TrBagg, BETL, and TBEL) using CP SAR of CTLR mode (a, b, c, d, e, and f are six transfer experiments, and a1-f1, a2-f2, and a3-f3 are the transfer classification results based on the TrBagg, BETL, and TBEL algorithms, respectively).
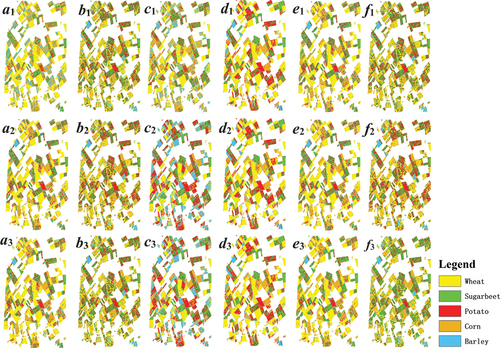
Table 13. Transfer classification accuracy based on three transfer algorithms.
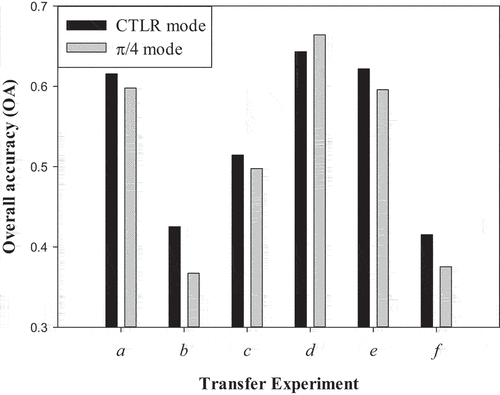
Figure 11. Transfer classification accuracy of crops based on the TBEL algorithm using CP SAR of CTLR and π/4 modes.
Supplemental material.docx
Download MS Word (18.8 KB)Data availability statement
The data that support the findings of this study are available upon reasonable request from the first author [Xianyu Guo. E-mall: http://[email protected]].