
Figures & data
Table 1. Band specifications of Landsat 8–9 OLI/TIRS sensors.
Figure 1. Experimental areas with diverse land cover types in South Korea and the United States (images shown from May 7, 2020, and July 4, 2022, respectively).
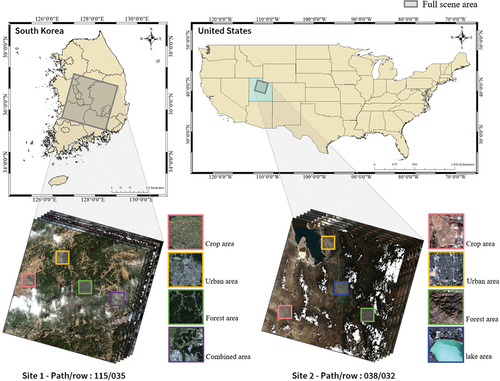
Figure 2. Workflow of the cloud detection and TSSG restoration algorithm.
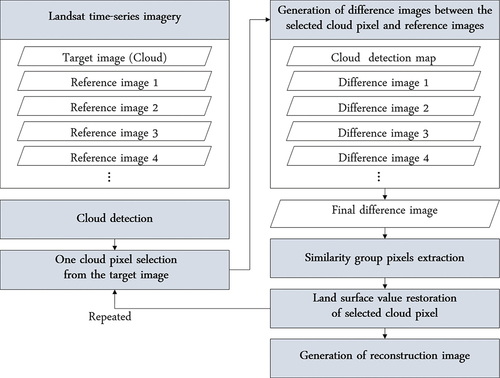
Table 2. Pixel quality classification types from Landsat QA band.
Figure 3. Sample images of cloud maps according to cloud confidence from QA image: (a) cloud RGB image acquired on April 4, 2020, in path/row 115/35, (b) cloud map A, (c) cloud map B, (d) cloud map C, (e) cloud map D, and (f) cloud map E.
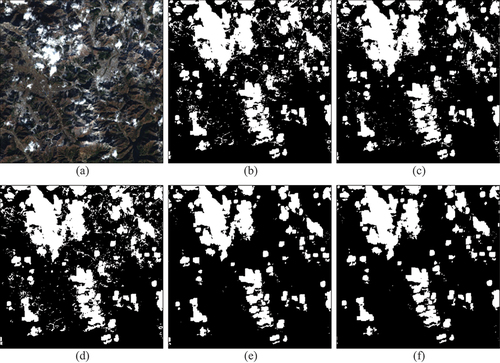
Table 3. Cloud maps based on the level of cloud confidence from QA image.
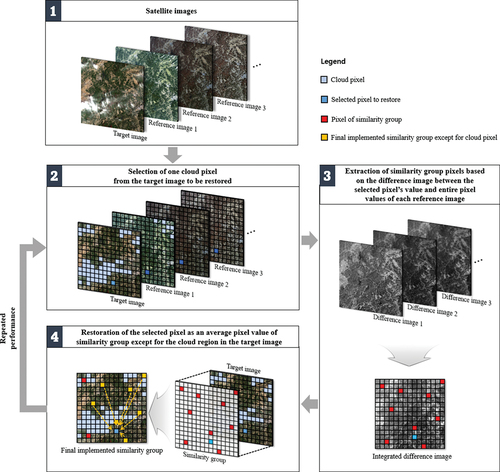
Figure 4. Proposed TSSG cloud regions restoration technique.
Table
Table 4. Equation of indices for evaluating the accuracy of cloud region restoration.
Table 5. SSIM, PSNR, NRMSE, and MAPE values of SSG and TSSG algorithms-based reconstruction images at two sites.
Figure 5. Visual comparison examples of true-color restoration results in site 1, South Korea. The second and third lines of each figure depict enlarged images of the red rectangle regions: (a) Landsat 8 original cloud-free images on March 20, 2020, (b) cloud simulation images, (c) restored images using SSG, and (d) restored images using proposed TSSG (Landsat 8 on November 29, 2019 and April 5, 2020 were used for restoration as reference data).
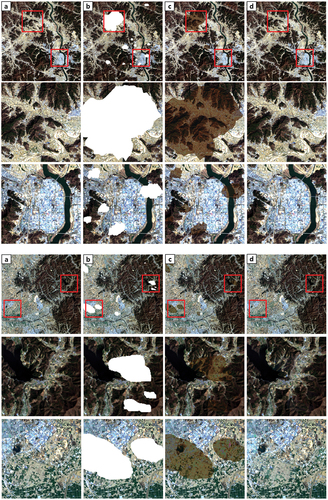
Figure 6a. Visual comparison examples of true-color restoration results in site 2, USA. The second and third lines of each figure depict enlarged images of the red rectangle regions: (a) Landsat 8 original cloud-free images on September 25, 2023, (b) cloud simulation images, (c) restored images using SSG, and (d) restored images using proposed TSSG (Landsat 9 images on August 29, 2022 and October 19, 2023 were used for restoration as reference data).
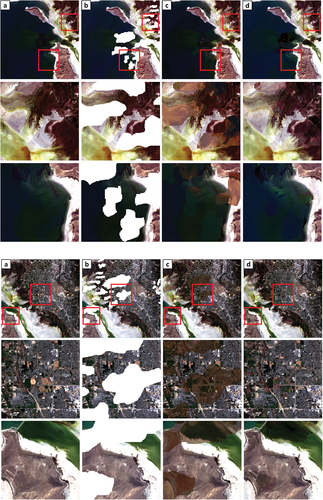
Figure 6b. (Continued)
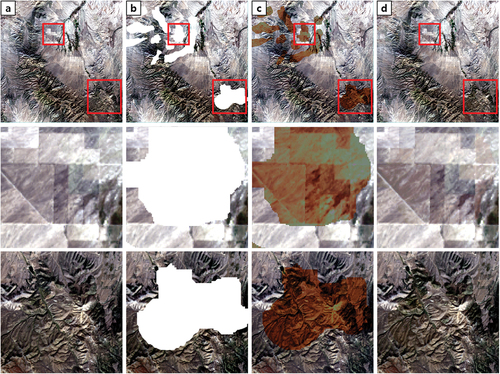
Figure 7a. Visual comparison examples of restoration results. The second and third lines of each figure depict enlarged images of the yellow rectangle region: (a) Landsat 8 images on March 4, 2020, South Korea, (b) Landsat 8 images on December 17, 2020, South Korea, (c) Landsat 9 images on April 3, 2022, USA.
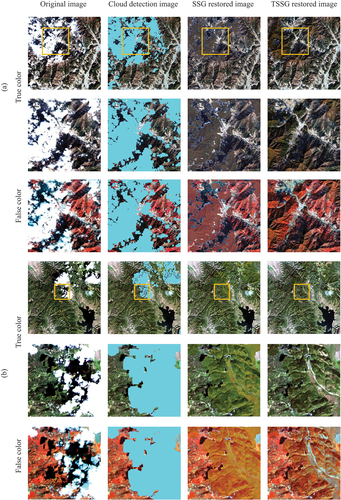
Figure 7b. (Continued)
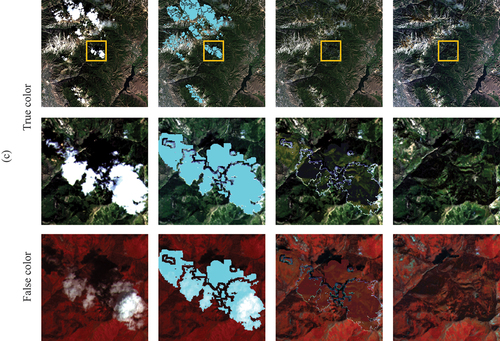
Figure 8. Experimental true-color images from Landsat 8 with abrupt land cover change by wildfire in South Korea. The second lines of each figure depict enlarged images of the red rectangle regions: (a) cloud simulation image on 31 December 2019, (b) first reference image on 5 April 2020, (c) second reference image on 8 June 2020 including regions affected by wildfires.
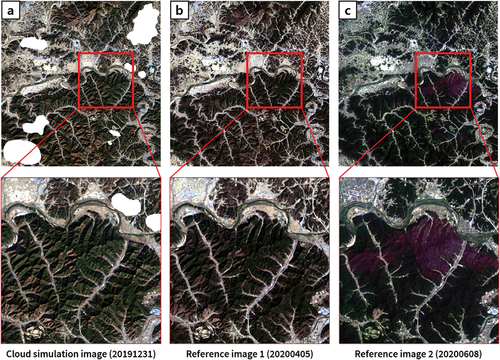
Table 6. SSIM, PSNR, NRMSE, and MAPE values of TSSG reconstructed images according to the number of reference images in two sites.
Table 7. SSIM, PSNR, NRMSE, and MAPE values of TSSG reconstructed images according to the cloud ratio of reference images in two sites.
Table 8. SSIM, PSNR, NRMSE, and MAPE values of TSSG reconstructed images according to the similarity group pixel ratios in two sites.
Table 9. Comparisons of SSIM, PSNR, NRMSE, and MAPE between SSG and TSSG cloud restoration results for site 1 (South Korea).
Table 10. Comparisons of SSIM, PSNR, NRMSE, and MAPE between SSG and TSSG cloud restoration results for site 2 (USA).
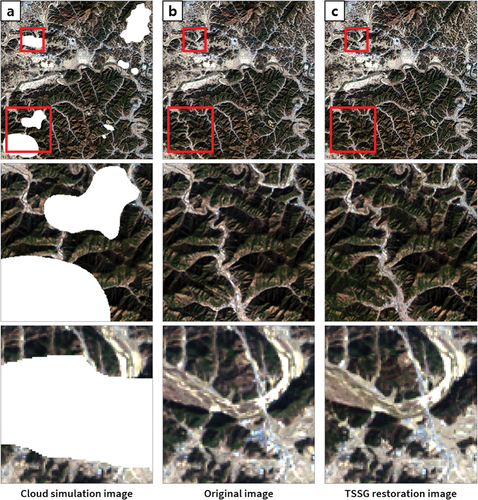
Figure 9. The performance of TSSG using wildfire-affected image as supplementary material. The second and third lines of each figure depict enlarged images of the red rectangle regions: (a) cloud simulation images, (b) original cloud-free images, (c) restored images using proposed TSSG.
Data availability statement
The dataset will be open to public via https://github.com/YerinYun17/TSSG.