
Figures & data
Figure 1. Location and sampling sites (96 study sites located in 3 areas) in Liangshan Yi Autonomous Prefecture. The background DEM map used in the upper left map is from ASTER GDEM 30M. The other three maps (1, 2, and 3) used World_Imager from the Environmental Systems Research Institute (ESRI) as the background map.
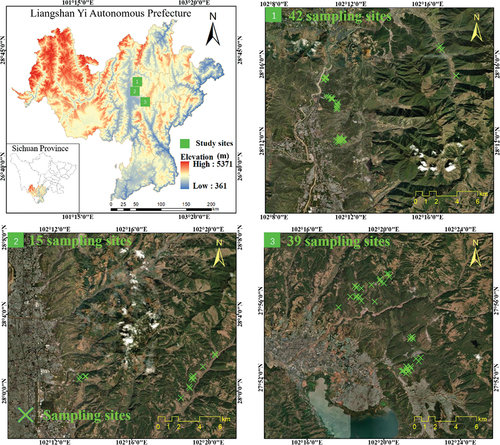
Figure 2. Diagram of dead fuel. Where 1-h dead fuel usually refers to dead fuel with diameter less than 0.635 cm.
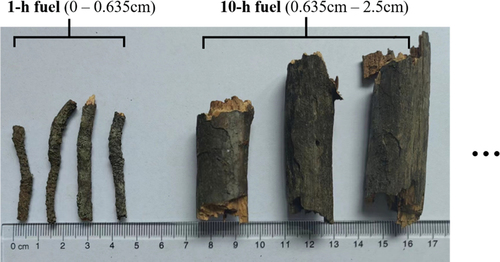
Table 1. The satellite data (including himawari-8 and GK2A) and gridded weather data (GFS) used in this study.
Figure 3. The flow chart of our approach, including sensitivity analysis, remote sensing of meteorological variables and process-based models.
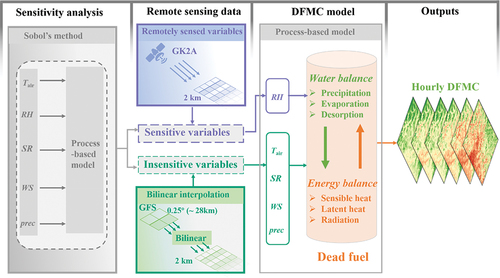
Figure 4. The schematic diagram of the process-based model, FSMM, in which the dead fuel (e.g. pine branches) is idealized as a cylinder. The FSMM modelled the water and energy balance processes with input of meteorological variables.
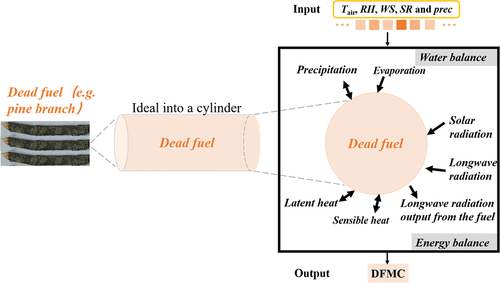
Table 2. Ranges of input meteorological variables used for sensitivity analysis (in simulations). These ranges were determined using the prior knowledge of meteorological conditions in Liangshan.
Table 3. Summary of methods used to estimate meteorological variables. Among them, Tair, RH and SR were from satellites while WS and prec from GFS.
Table 4. The Si, STi of meteorological variables (including Tair, RH, SR, WS and prec) required by the process-based model, FSMM.
Figure 5. Performance of FSMM using different sources of input variables: (a) All input variables from GFS, (b) Satellite-derived RH and other variables from GFS, (c) Satellite-derived RH, Tair, SR, and other variables from GFS, (d) Satellite-derived RH and field-measured Tair and WS. (e) Field-measured RH, Tair and WS.
Figure 6. The performance of the Simard (a), Random forest regression (b), and the FSMM (c) Using satellite-derived RH and other variables from GFS.
Figure 7. The 1-h DFMC maps (hourly from local time 8:00 to 15:00) of Liangshan prior to the Xichang fire, which occurred at 15:35 on March 30, 2020. Maps with DFMC estimation were masked by evergreen needle-leaved forests in the global land-cover product (GLC_FCS30) (Zhang et al. Citation2021). The DFMC in the grey pixel is missing due to the lack of RH values caused by cloud cover. And the white pixel means that the vegetation type is not evergreen needle-leaved forests.
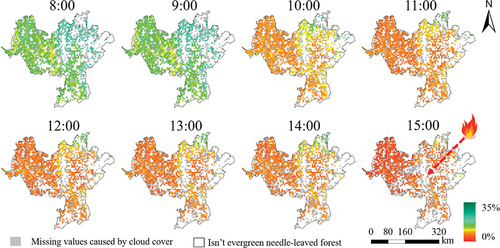
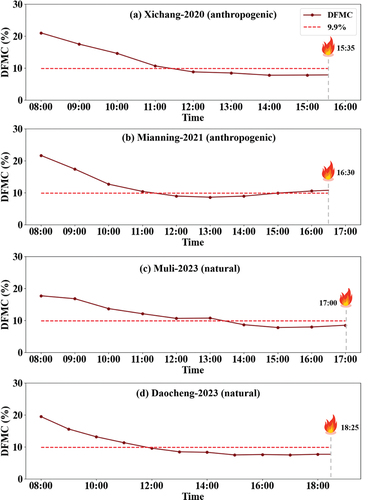
Figure 8. The DFMC trends in the burned area of wildfires ((a) Xichang-2020, (b) Mianning-2021, (c) Muli-2023, and (d) Daocheng-2023). The dashed red line indicates the threshold values (9.9%, as suggested by Nolan et al. (Citation2016a)) associated with the fire potential in forests.
Data availability statement
The Himawari-8 LST data are available from Copernicus Global Land Service (CGLS) (https://land.copernicus.eu/global/products/lst, last visit on 12th September, 2023). The Himawari-8 SR and reflectance Data can be download using ftp (ftp.ptree.jaxa.jp, last visit on 12th September, 2023).The GK2A WV product (Total Precipitable Water) is available from National Meteorological Satellite Center (NMSC) of Korea Meteorological Administration (KMA) (https://datasvc.nmsc.kma.go.kr/datasvc/html/data/listData.do, last visit on 24th December, 2023). The 1-h field measured DFMC data used in this study will be made available on request.