
Figures & data
Figure 1. Conceptual graph model for the PKG.
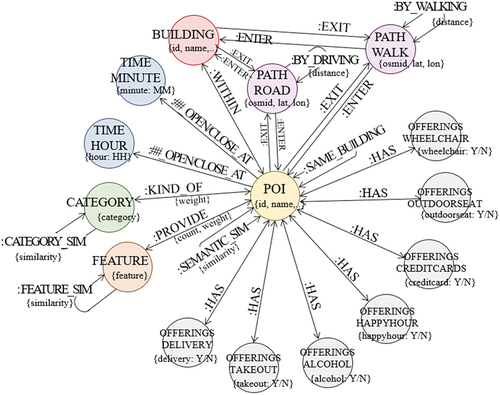
Table 1. Offered items common across Yelp, FSQ, and Google Maps and sub-entities of OFFERINGS.
Figure 2. Method of calculating based on the hierarchical structure of categories.
Figure 3. Data for the test area.
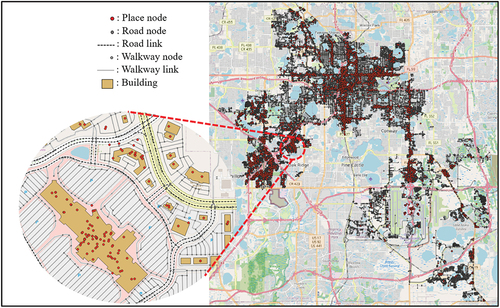
Table 2. Construction results of the PKG.
Table 3. Available POI counts for OFFERINGS.
Table 4. POI retrieval results.
Figure 4. POI retrieval results using the attribute and semantic graphs; entities denoted by the following colors: retrieved place (POI) (orange), CATEGORY (purple), OUTDOORSEAT (beige), FEATURE (yellow), HOUR (light green), and MINUTE (green): (a)–(f) indicate the results to queries 1–5, respectively.
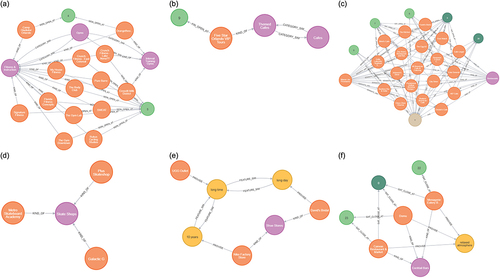
Figure 5. POI retrieval results with optimal routes; entities are denoted by the following node colors: retrieved place (POI) (orange), START (pink), and BUILDING (sky blue). The optimal paths are represented by the directed “PATH_0” type relationships and small beige nodes: (a) query 3, (b) query 5, (c) query 8.
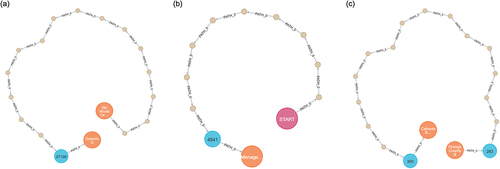
Figure 6. POI retrieval results with optimal routes for query 4; entities denoted by the following node colors: retrieved place (POI) (orange), START (pink), and BUILDING (sky blue): (a) optimal walking paths represented by the directed “PATH_0” type relationships and small beige nodes; (b) optimal driving paths represented by the directed “PATH_0” type relationships and small gray nodes.
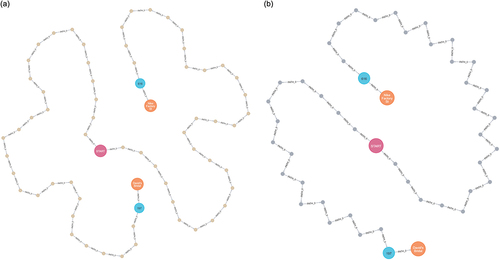
Figure 7. Map visualization of extracted optimal walking route (fig. 5(b)) with OSM data for query 5.
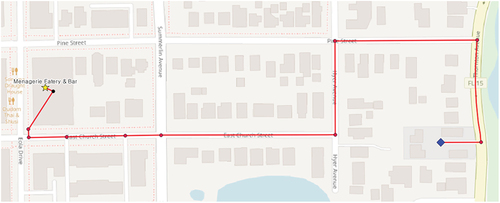
Figure 8. Result of query 4 with different similarity criteria: (a) 0.5, (b) 0.7.
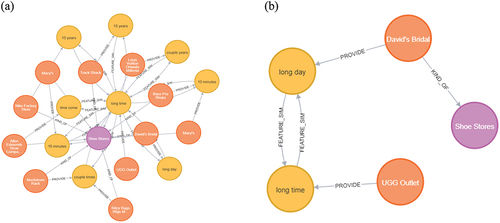
Figure 9. POI retrieval results using building nodes for queries 6–8; entities denoted by the following colors: retrieved place (POI) (orange), CATEGORY (purple), WHEELCHAIR (beige), and BUILDING (sky blue): (a)–(d) indicate the results to queries 6–9, respectively.
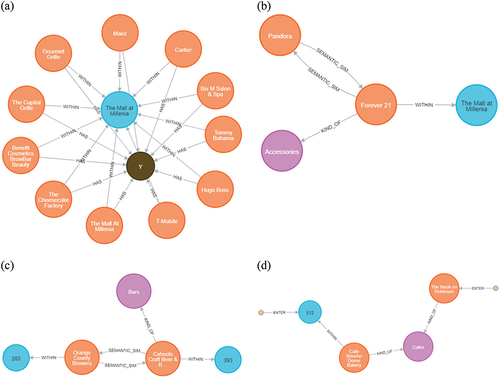
Figure 10. POI retrieval results for query 9; entities denoted by the following colors: retrieved place (POI) (orange), CATEGORY(purple), FEATURE(yellow), BUILDING(sky blue). The part of the graph with small beige nodes and “PATH_0” type relationships represents the outdoor walking paths, whereas the part of the graph with green nodes and “PATH_0” type relationships represents the indoor walking paths.
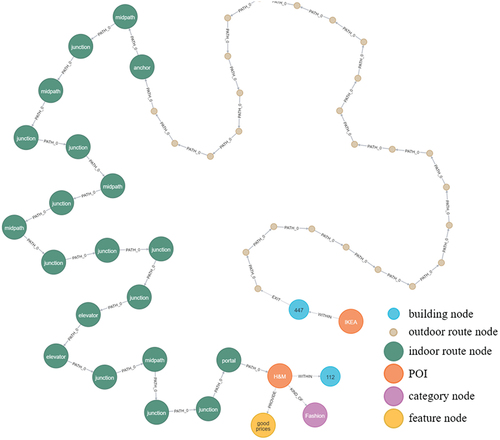
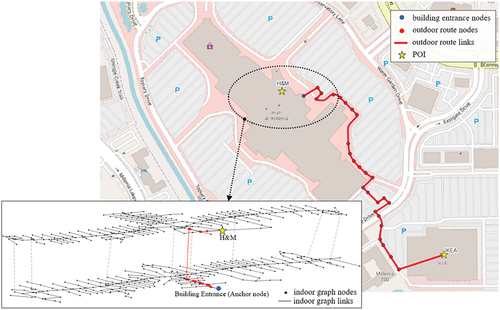
Figure 11. Visualization of the extracted optimal path for query 9 using the OSM data and 3D indoor networks.
Data availability statement
The data that support the findings of this study are available from the corresponding author, Youngmin Lee, upon reasonable request.